Scientists at the Virginia Institute of Marine Science measured sea-level rise at 32 tide-gauge stations along the U.S. coastline. Rockport and Galveston had the second- and third-highest rates of rise in 2019.
Rockport Beach Park
Scientists increasingly cite not just sea-level rise but its accelerating rate as a key reason for concerted action to attack climate change. A study released this week, with prominent findings about coastal locations in Texas and Louisiana, provided new evidence of the acceleration trend that the authors said deserves attention by climate-resilience planners.
Rising sea levels exacerbate coastal hazards in various ways – increasing routine flooding and erosion and magnifying hurricanes’ storm surge.
The new study by scientists at the Virginia Institute of Marine Science determined that sea levels rose last year at 27 of 32 tide-gauge stations along the U.S. coastline, and levels at 25 of the 32 stations rose at higher rates than in 2018.
Rockport, near Corpus Christi, and Galveston, in the Houston area, had the second- and third-highest rates of sea-level rise in 2019 among the 32 stations. Grand Isle, La., near New Orleans, had the highest rate of rise.
The nation’s highest rate of sea-level-rise acceleration occurred last year at Rockport, while the 10th-highest acceleration rate was recorded at Port Isabel, near the Texas-Mexico border.
The latest annual “sea-level report cards” from the marine institute at the College of William & Mary complement other scientific conclusions in recent years. A NASA study using satellite data found in 2018 that “the rate of global sea-level rise has been accelerating in recent decades, rather than increasing steadily.” The National Oceanic and Atmospheric Administration (NOAA) reported last November that the fastest U.S. rates of sea-level rise are occurring along the Louisiana and Texas coastlines.
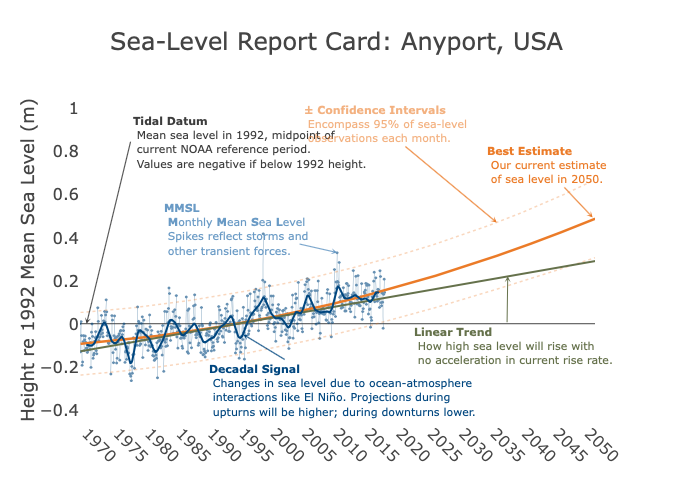
The Virginia Institute of Marine Science provides this guide for understanding charts in its place-specific report cards for sea-level rise in 2019. The chart below displays the institute’s projection for Rockport, Texas.
The Virginia researchers said the locally focused findings in their annual reports can serve as important warnings to residents. The yearly reports are updated more often than reports by NOAA and other agencies.
“The key message from the 2019 report cards is a clear trend toward acceleration in rates of sea-level rise at 25 of our 32 tide-gauge stations,” said John Boon, the report-card project’s founder. “Acceleration can be a game changer in terms of impacts and planning, so we really need to pay heed to these patterns.”
Molly Mitchell, a marine scientist at the institute, said the acceleration trends in the tide-gauge records “need to be seriously considered in resilience-planning efforts.”
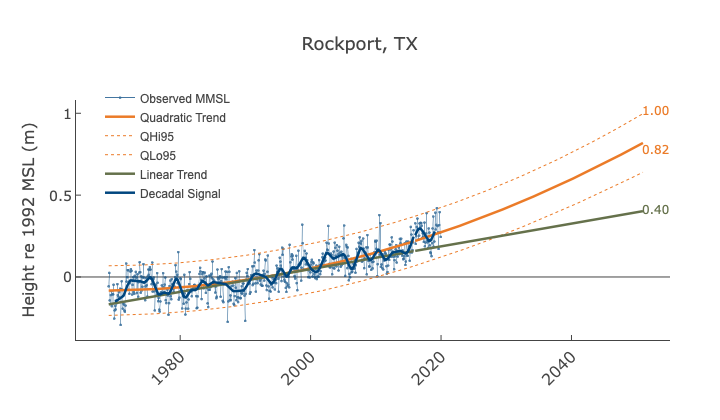
This chart displays the sea-level projection in the Virginia Institute of Marine Science’s 2019 report card for Rockport, Texas. The chart above is the institute’s key for understanding charts for different locations, including this one.
An announcement by the marine institute included these details about Texas and Louisiana:
The three highest rates of sea-level rise in 2019 occurred along the Gulf Coast at Grand Isle, La., (7.93 millimeters per year, or mm/yr) and at Rockport (6.95 mm per yr) and Galveston (6.41 mm per yr), Texas. Rockport also topped all 32 stations in its rate of acceleration, at 0.26 millimeters per year per year, or mm/yr2. If this continues, sea level (at Rockport) will be 0.82 meters (2.69 feet) higher in 2050 compared to 1992. Grand Isle and Galveston showed significant but much more moderate acceleration rates in 2019, at 0.05 mm/yr2 and 0.09 mm/yr2, respectively. The 2050 projections for sea-level rise at these sites is thus appreciably lower: 0.54 meters (1.77 feet) at Grand Isle and 0.51 meters (1.67 feet) at Galveston.
The U.S. Interagency Sea Level Rise Taskforce concluded in 2017 that, averaged globally, the planetary sea level “is very likely to rise at least 12 inches (0.3 meters) above 2000 levels by 2100 even on a low-emissions [of climate-altering pollution] pathway,” NOAA’s November 2019 report said.
“For the densely populated Atlantic seaboard north of Virginia and the western Gulf of Mexico, sea-level rise will likely be higher than the global average for all [emissions] pathways,” the report said.
Scientists stress the important role of local and regional factors in varying rates of sea-level rise at different locations. The announcement by the Virginia Institute of Marine Science about its report cards for 2019 noted, for instance, that Mitchell and Boon “attribute the high rise rates and sharp contrast in acceleration among these Gulf Coast stations [that they studied in Texas and Louisiana] in part to their location within a sedimentary basin with a complex history of water and mineral extraction. Pumping of groundwater and oil can cause land subsidence, which contributes to relative sea-level rise.”
Texas Climate News asked John Anderson, an oceanography professor at Houston’s Rice University and a leading authority on sea-level issues in the Gulf of Mexico, to comment on the Virginia institute’s latest findings.
Mitchell had said the Virginia researchers’ finding of “acceleration at so many of our stations” suggests “we may be moving towards [NOAA’s] higher projections” for global sea-level rise. But Anderson expressed a somewhat differing view.
“There is no question that sea-level rise is accelerating due to warming and expansion of oceans and melting glaciers and ice sheets,” he told TCN. “But I am inclined not to place too much value on such short-term results from tide-gauge records as an indication of global sea-level rise.”
There are “other factors that influence sea-level rise at these frequencies, and, in this case, the observed rise in the Gulf of Mexico is likely due to oceanographic effects,” he said. “It is well established that variations in circulation patterns involving loop currents result in sea-level fluctuations of centimeter scale over months to a few years, and this results in records that show centimeter-scale variability over such short time scales.”
Over decades, however, tide-gauge readings do show “an overall acceleration, as confirmed by satellite data, with the current rate being about 3 millimeters per year relative to the long-term rate, derived from geological data, which shows an average rate of 0.5 mm per year over the past 4,000 years,” Anderson added.
“None of this is surprising to scientists,” he said, “because it is consistent with long-term measurements that reveal increasing ocean temperatures, the fact that the majority of land-based glaciers are retreating and observations from Greenland and West Antarctica that indicate melting of these ice sheets.”
+++++
Bill Dawson is the founding editor of Texas Climate News.