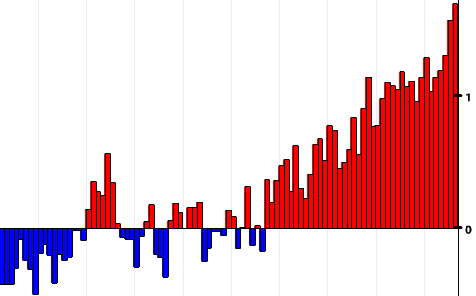
Detail of NOAA chart showing the January-November period in 2016 was the hottest on record. See full chart below.
By Bill Dawson
Texas Climate News
Donald Trump says he doesn’t accept the science of global warming, but the the data supporting that science keep piling up, as recent announcements underscored.
Based on temperature measurements through November, leading climate science organizations said it appears 2016 will probably be the planet’s hottest on record despite the earlier waning of a temperature-boosting El Niño, a cyclical weather pattern.
“The year 2016 remains on track to be the hottest year on record, with average global temperatures set to break even the records of 2015, according to data covering the first eleven months of the year,” the Geneva-based World Meteorological Organization declared this week.
“Temperatures spiked in the early months of 2016 because of a very strong El Niño event and remained well above the long-term average for the latter part of the year, according to the reports from NASA’s Goddard Institute for Space Studies, the U.S. National Oceanic and Atmospheric Administration and the European Centre for Medium Range Weather Forecasts.”
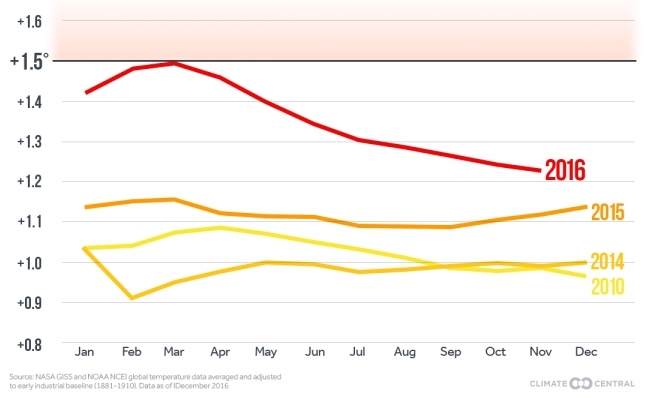
A chart by the nonprofit Climate Central organization, based on NASA and NOAA data, shows global average temperature trends for 2016 and the three years that now rank as the three hottest on record. To avoid the worst impacts of climate change, the 2015 Paris Climate Agreement stated that the world should reduce greenhouse-gas pollution to keep global temperatures well below 2 degrees Celsius above pre-industrial levels and should try to limit them to 1.5 C above those levels. As this chart shows, global average temperatures briefly reached the 1.5 C level early this year.
If 2016 does end up as the year with the hottest average global temperature since record-keeping started in the late 19th century, it will replace 2015 at the top of NOAA’s hottest-years list. In second place on that list is 2014. Of the 16 years on it, all but 1998 were in the 21st century.
In its monthly State of the Climate report this week, NOAA sized up the chances for 2016 to end up as the hottest to date:
With only one month left in the year, the 2016 year-to-date global temperature (January–November) was the highest on record for this period, at 0.94 degrees Celsius (1.69 degrees Fahrenheit) above the 20th century average of 14.0 degrees C (57.2 degrees F). This value exceeded the previous record set in 2015 by 0.07 degrees C (0.13 degrees F). Unless the December global temperature is 0.25 degrees C (0.41 degrees F) or less above the 20th century monthly average, 2016 will at least tie 2015 as the warmest year in the 137-year record. The last month for which the departure from average was that low was November 2000.
Some who reject mainstream climate science, such as Republican Lamar Smith, the San Antonio attorney who chairs the House science committee, have suggested that less-elevated global temperature averages for a few months following this year’s completion of the El Niño pattern somehow undercut scientists’ consensus conclusions that hazardous, long-term warming is happening due to human pollution from greenhouse gases.
The World Meteorological Organization made clear in its announcement, however, that those scientific conclusions remained solid in 2016: “Long-term indicators of human-caused climate change, including record carbon dioxide concentrations, and glacier melt, and low sea ice, continued.”
The WMO announcement quoted the organization’s secretary-general, Petteri Taalas, who holds a PhD in meteorology from the University of Helsinki.
“The climate has broken records in 2016. In the atmosphere, carbon dioxide levels were above the symbolic level of 400 parts per million. In the oceans, record warmth contributed to widespread coral reef bleaching. And on land, droughts, floods and tropical cyclones disrupted the lives of millions of people as well as progress towards socio-economic development. A part of the disasters may be linked to climate change.”
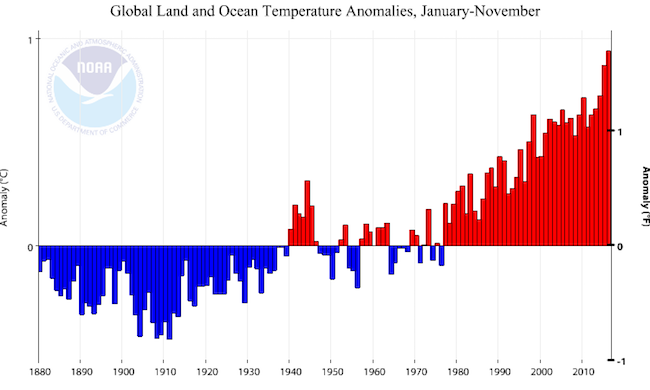
This NOAA chart shows how much average annual global temperature readings for January-November departed from the 20th century average for that 11-month period.
+++++
Bill Dawson is editor and founder of Texas Climate News.