If a picture’s worth a thousand words, how about a map?
The National Oceanic and Atmospheric Administration published one recently that, at a glance, could help explain why some people persist in thinking that a spell of cooler-than-normal weather where they live somehow debunks the longterm trend of manmade global warming that climate scientists almost universally affirm.
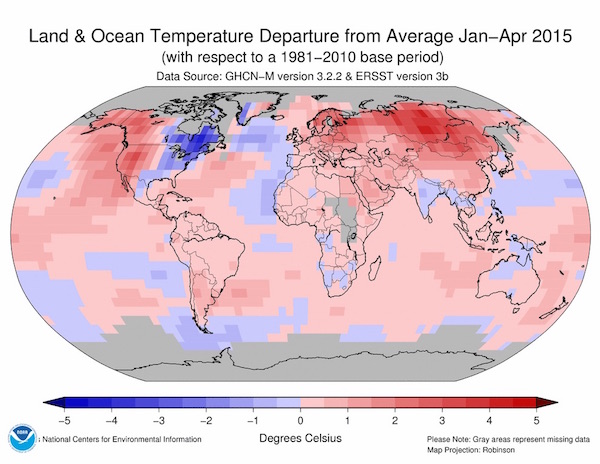
The map in question, issued as part of NOAA’s latest monthly global climate analysis, shows areas of the earth that were warmer (shades of red) and cooler (shades of blue) than the 1981-2010 period in the first four months of this year. The agency said the January-April period in 2015 was the warmest on record – that is, since 1880.
But not everyplace on the planet was warmer than usual, of course – that’s what “average” connotes. The most notably cooler-than-average land area stretched from northeastern and central Canada southwestward into Texas and northeastern Mexico.
Some people living in that area may have wondered, as they bundled up against the frigid air, what all the global warming fuss is about.
It’s a meme that some politicians from Texas and other oil-and-gas-producing states have sought to reinforce.
In February, for instance, Sen. Jim Inhofe of Oklahoma, who has famously said scientists’ conclusion that fossil-fuel pollution is heating up the atmosphere is “a hoax,” tossed a snowball on the Senate floor to illustrate, one more time, his disbelief in the human-climate connection.
Despite being ridiculed for the snowball throw — a Washington Post reporter sarcastically noted it had “once and for all, disproven climate change” – Inhofe evidently regards it as an effective communication aid. Last week, a video loop of the toss was projected behind him as he spoke to a conference for climate-change doubters, dismissers and deniers.
The Oklahoman was not alone among members of Congress in using the then-frigid conditions to cast doubt on climate science early this year. The House majority whip, Republican Steve Scalise of Louisiana, remarked in a committee hearing: “I know the president loves talking about global warming – and they’re canceling flights all around the country due to snow blizzards.”
Nevertheless, the NOAA report indicated that a 12-month period including that snowfall – extending from May 2014 through April 2015 – was tied with one other 12-month span as the warmest such period on record.
The other period tied as the warmest was April 2014 through March 2015. Just behind them as the next-warmest 12 months was March 2014 through February 2015.
Climate Central, a nonprofit research and reporting organization, noted that nine of the 10 warmest 12-month periods since 1880 have happened in the past two years, “most of them in back-to-back stretches.”
The clustering of such warm periods is a marker of how much global temperatures have risen thanks to the human-driven buildup of heat-trapping gases in the Earth’s atmosphere.
April’s heat also ensured that 2015 is still the warmest year-to-date on record. And with a healthy looking El Nino that could further intensify in the coming months, the chances that the year as a whole could best last year’s record-breaking temperature are boosted.
A recent study calculated how much of an impact greenhouse gases from fossil-fuel use are having now on temperatures on the warmest days, separate from the additive impact of cyclical events like El Nino.
The study, published in the scientific journal Nature Climate Change, concluded that about 75 percent of extremely hot days are now caused by pollution-driven climate change and projected the proportion will exceed 95 percent around the middle of the century.
Meanwhile, in another NOAA report issued in May, the federal agency said it had recorded, for the first time, an average monthly global concentration of carbon dioxide, the principal greenhouse gas from human activities, at 400 parts per million.
NOAA’s Pieter Tans, lead scientist of its Global Greenhouse Gas Reference Network, which uses readings from 40 sites, said in an agency release that it was the first monthlong average showing humans caused have caused concentrations of heat-trapping CO2 to rise more than 120 parts per million since pre-industrial times.
Half of the increase, he added, has happened since 1980.
Added James Butler, director of NOAA’s Global Monitoring Division: “Elimination of about 80 percent of fossil fuel emissions would essentially stop the rise in carbon dioxide in the atmosphere, but concentrations of carbon dioxide would not start decreasing until even further reductions are made and then it would only do so slowly.”
Tans told NPR: “What troubles me is that we’re still headed at full speed in a direction that we should not be going. We are at the beginning of bringing about huge changes in the Earth’s climate and ecosystems. The potential is there for us to make life hard, really, for future generations.”
– Bill Dawson