
Hong Kong
Sophie Yeo and Simon Evans
Carbon Brief
Is it possible to reduce emissions while growing the economy? This is a major question for policymakers hoping to combat climate change.
Historically, emissions have increased as the global economy has developed. More people have access to electricity and transport in richer countries. In many cases, development has also been associated with an increase in carbon-intensive industrial activity.
This has led to a debate often conducted on ideological grounds.
Some, including scientist Kevin Anderson and author Naomi Klein, argue against certain types of economic growth in the interests of shrinking emissions.
But in a world where 836 million people still live in extreme poverty, and people in the developed world enjoy all the benefits that a large economy brings, shrinking the economy in the name of climate change is a tough political sell.
David Cameron, the U.K.’s prime minister, has said that there is no need for a “trade-off” between economic growth and reducing carbon emissions. President Barack Obama has expressed a similar sentiment.
Recent real-world data on the economy and emissions suggests they could be right. The International Energy Agency (IEA) says that global emissions stalled in both 2014 and 2015, even as the economy grew.
Regional variation
However, it is not enough for global emissions to stall. In the interests of maintaining a planet where global temperature rise stays well below 2 degrees C, and preferably below 1.5 C, the U.N. has said that emissions must fall to net zero in the second half of the century.
The IEA’s analysis masks considerable regional variety. The global stalling of emissions in 2014 and 2015 is the product of rising emissions in most countries, accompanied by a reduction in others.
Most of the countries that have cut their emissions have also grown their economies. This means that, for a handful of nations, the process of decoupling emissions from the economy is well underway.
The World Resources Institute, a climate think-tank based in Washington, has this week released analysis showing which countries have achieved this decoupling, by comparing BP data on emissions to World Bank data on GDP.
The BP data contains emissions statistics from 67 countries. Of these, 21 have succeeded in decreasing their emissions while growing their GDP in the period 2000 to 2014.
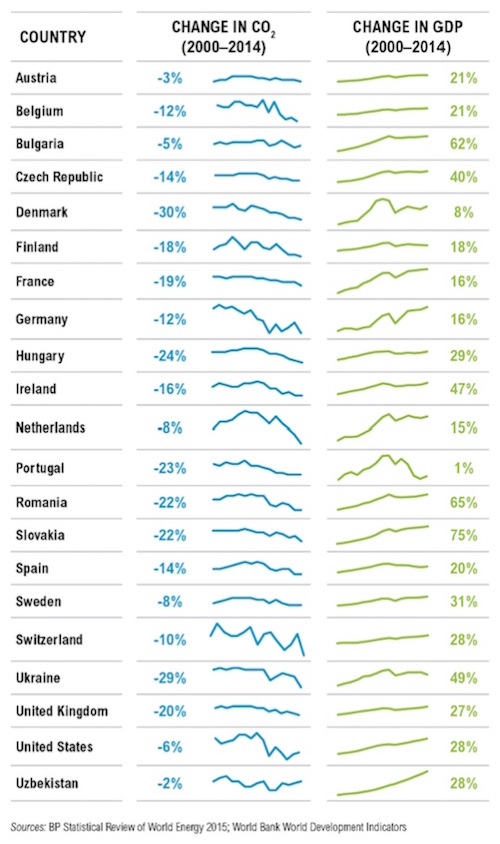
Nate Aden, WRI’s research fellow who carried out the analysis, tells Carbon Brief that the findings showed a “positive story of emerging transformation.” He adds that he focused on the 14-year period “to ensure that the observed decoupling is sustained and significant.”
According to WRI’s analysis, the U.S. achieved the largest reduction in CO2, but this is largely because it emitted so much CO2 to begin with. Denmark achieved the largest reduction proportional to its starting emissions, cutting CO2 to 30 percent below 2000 levels — “though 17 million tons of CO2 is a drop in the bucket globally,” Aden adds.
It’s worth noting that the choice of time period can have a large impact. For instance, U.S. emissions increased between 1990 and 2014.
The aim for these countries now is to maintain and accelerate this decoupling. Even the climate pledges that countries have made for the next decade will only succeed in limiting global temperature rise to around 2.7 C, according to analysis by Climate Action Tracker. The U.N. is expected to update its own analysis of these pledges imminently.
Wider analysis
Carbon Brief has extended the WRI analysis to consider all the countries in the world, not just the 67 included in BP’s statistics. Like WRI, this extended analysis looks at changes in real GDP using data from the World Bank. Carbon Brief used real GDP data in each country’s local currency.
Our analysis used CO2 emissions data for 216 countries from the Carbon Dioxide Information Analysis Center (CDIAC). These countries include the likes of the tiny island of Réunion; there are only 195 U.N. member states.
Some 45 of these nations cut their CO2 emissions between 2000 and 2014. Only 35 increased their real GDP at the same time (table, below). Another four cut emissions while their GDP shrank. No GDP data was available for the remaining six countries.
Singapore achieved the largest emissions reduction in percentage terms, with 46 percent. Denmark’s 33 percent was next best and the Ukraine came third with 32 percent.
Looking at carbon intensity — the CO2 emissions per unit of GDP — Macao, Singapore and Uzbekistan made the largest improvements.
The U.K. cut its emissions by 128 million tons of CO2 between 2000 and 2014, a 24 percent reduction. At the same time, its real GDP grew by 27 percent. As a result, its carbon intensity dropped 40 percent. This was the biggest improvement among major economies that decoupled their emissions from growth, between 2000 and 2014.
Consumption-based emissions
Carbon Brief has created two additional tables, for reference. These include all countries with data available, not just the countries whose GDP grew while CO2 emissions fell.
The first table shows data for 2000-2014 using territorial emissions. The second table shows data for 2000-2013 using consumption-based CO2. Follow the links to view the tables. Both are based on CDIAC calculations for the Global Carbon Project.
Only 21 countries decoupled their economic growth from consumption-based CO2 emissions between 2000 and 2013. This suggests some countries were only able to decouple by “offshoring” some of their emissions to other countries.
However, major economies including the U.K., U.S., France and Germany still decoupled, even after accounting for the CO2 contained in imported goods. Carbon Brief has looked at the U.K.’s consumption-based emissions in more detail.
Canada and Poland were among those that failed to decouple their consumption-based CO2 emissions from economic growth.
+++++
Carbon Brief is a U.K.-based website covering the latest developments in climate science, climate policy and energy policy. It specializes in “clear, data-driven articles and graphics to help improve the understanding of climate change, both in terms of the science and the policy response.”