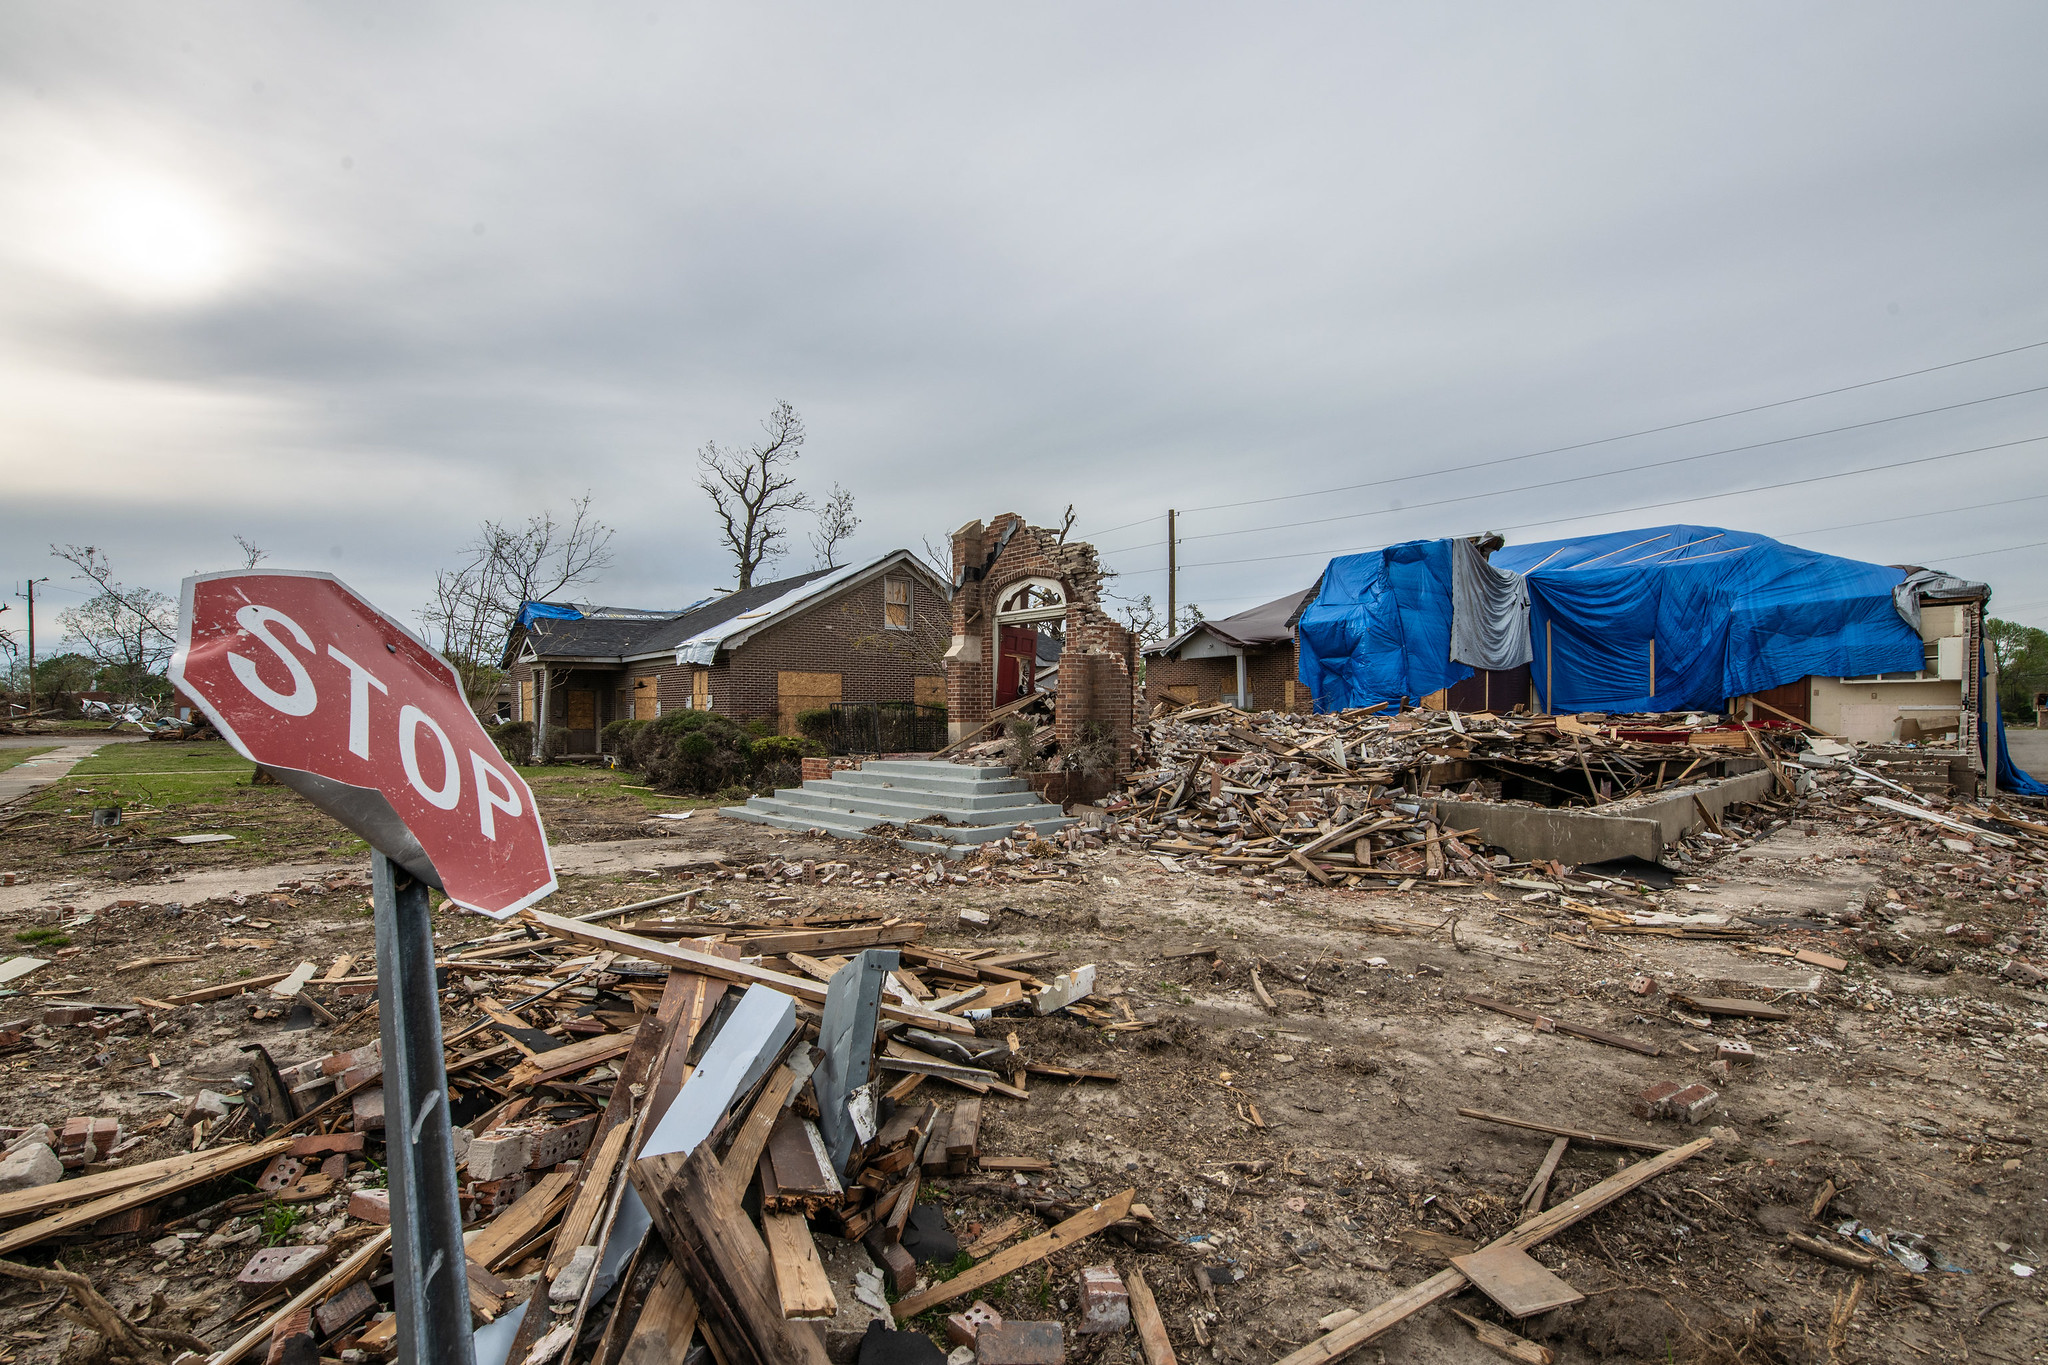
A top-end EF4 tornado, the strongest and deadliest tornado to strike the U.S. in 2023, crashed through Rolling Fork, Miss., on March 24. Packing top winds estimated at 195 mph, the tornado took 17 lives and injured 165 people along its 59-mile-long path. Lance Cheun / USDA Media (U.S. Department of Agriculture), Public Domain
This article was originally published by Yale Climate Connections.
The drumbeat of record weather and climate phenomena — hottest, wettest, fieriest, fiercest, and so on — can sometimes fade into the background, like the repetitive backdrop to a mournful dirge. Then there are those sharp moments, like a cymbal crash, when the atmosphere jolts us to attention. The past year has been riddled with such moments, some of them reflecting the vagaries of extreme weather and others more firmly connected to the effects of human-caused warming from fossil fuel use. Below are quick looks at some of the wildest facts about the past year’s weather and climate.
1. The U.S. county most often in a hurricane forecast cone in 2023 was in Maine.
No other county in the contiguous United States is as far east as Washington County, Maine. It’s on the coast right next to Atlantic Canada, and it’s farther north than Minneapolis. Yet this remote corner of Maine was at risk of hurricanes and tropical storms more often than anywhere else in the nation, judging by the amount of time spent within the forecast cones issued by the National Hurricane Center. (These cones encompass the area ahead of each tropical cyclone where there’s at least a two-thirds chance of the center passing over any given point; they’re calculated using the center-line forecast together with the preceding five years of storm behavior.)
The westerly upper-level winds that prevailed in the 2023 Atlantic hurricane season steered most of this year’s named storms eastward, well away from the Gulf, Southeast, and mid-Atlantic coasts. Yet several systems managed to move north from the open Atlantic toward New England and Atlantic Canada. The list includes Hurricane Lee in September and a belatedly recognized subtropical storm in January, both of which made landfall in Nova Scotia, as well as Tropical Storm Philippe, which made landfall in Maine after evolving into a post-tropical cyclone.
Based on calculations by Yale Climate Connections contributor Michael Lowry (see Figure 1 above), far southeast Maine was inside a forecast cone for a cumulative total of 162 hours this year as a result of both Lee and Philippe. Only a few other U.S. spots were “coned” for at least 96 hours, including the eastern half of Maine and slivers of coastal Georgia, South Carolina, and North Carolina. In wild contrast, Louisiana and South Florida — two of the nation’s most hurricane-prone areas — didn’t spend a single minute of 2023 inside a forecast cone.
2. The year’s U.S. ratio of severe weather damage to hurricane damage was at least 10 to one.
Multiple onslaughts of intense late-winter and springtime thunderstorms, including massive hail and destructive downburst winds, gave the United States its costliest year of severe weather in modern records. The storms led to more than $54 billion in preliminary insured losses through September, according to the third-quarter Natural Catastrophe Report from insurance firm Gallagher Re. (Not yet included: damage from a deadly swarm of severe storms and tornadoes centered in Tennessee on December 9-10.) Only three U.S. hurricane seasons on record have topped this year’s severe weather for financial impact, even after adjusting for inflation. For example, on Aug. 11, severe weather inflicted more than $1 billion in insured U.S. damage, led by hail impacts in the Minneapolis area. Colorado experienced a record number of hail reports this year, as well as its largest hailstone on record (5.25 inches in diameter, Aug. 8).
Through Dec. 15, there were 82 U.S. tornado fatalities, with 49 of them in manufactured homes. Of the 82 deaths, 74 occurred in the first half of the year, making it the deadliest January-to-June period since 2011. A recent modeling analysis implies that supercell thunderstorms could increase in number by a few percent by later this century, and there have already been clear eastward shifts in U.S. tornado occurrence. Only a few of this year’s tornado deaths — eight in Texas and two in Oklahoma — occurred west of the Mississippi River Valley.
As for hurricane season, U.S. damages were on the order of $4 billion, the lowest since 2015, according to Gallagher Re. Most of that came from Hurricane Idalia, a Category 3 storm that crashed ashore in Florida’s sparsely populated Big Bend. After adjusting for inflation, Idalia was the nation’s least expensive major landfall since Hurricane Bret struck South Texas in 1999.
3. Scientists found that global warming made a catastrophic dam-breaching flood in Libya up to 50 times more likely.
The second-deadliest dam failure in world history unfolded in and near Derna, Libya, on Sept. 10-11. A storm named Daniel moved into the region after triggering disastrous rains and floods in southeast Europe and then moving across the Mediterranean Sea as a strong “medicane,” a tropical-like cyclone over the Mediterranean. Poor maintenance of two dams upstream from Derna likely contributed to the disaster, and prestorm warnings failed to reach many people at risk in the conflict-torn area.
In late October, the U.N. Office for the Coordination of Humanitarian Affairs reported that 4,352 people were killed and more than 8,000 were missing, making it the planet’s deadliest storm since Super Typhoon Haiyan in 2013. The deadliest dam disaster on record globally was the Banqiao Dam collapse in Henan Province, China, in August 1975, triggered by torrential rains from Typhoon Nina. That collapse killed at least 26,000 people, and perhaps as many as 240,000.
An analysis produced by World Weather Attribution estimated that the peak 24-hour rainfall averaged in a small area over and near the mountainous Jebel Akhdar region of northern Libya would be expected to occur only about once every 600 years. The report also found that global warming of 1.2 °C had made such an event up to 50 times more likely. About 40 miles west of Derna, the city of Bayda, atop the Jebel Akhdar plateau, recorded 414.1 millimeters (16.30 inches) from 8 a.m. local time Sunday to 8 a.m. Monday. This compares to Bayda’s September average of 6 mm (0.24 inches) and its annual average of 540 mm (21.26 inches).
4. Wildfires scorched 17 times as much land in Canada as in the United States.
Wildfire tore across North America in a bizarrely bifurcated fashion in 2023. The continental area burned by U.S. wildfire — about 2.6 million acres — was the least since 1998 and only about one-third of the annual average over the past decade. This was due in large part to generous rains and mountain snows that helped keep the Southwest moist and relatively mild well into summer, as well as the unusual arrival of late-summer moisture from Hurricane Hilary (see below). On Nov. 4, California was declared drought-free for the first time in more than three years.
Meanwhile, record springtime heat and drought dried out much of the landscape of southern and western Canada and pushed the nation’s fire season into premature overdrive. By June, destructive fires were already raging from the Canadian Rockies to Atlantic Canada, spewing massive volumes of smoke that periodically swept south into the United States and even reached Europe. Yellowknife, the second-largest city in northern Canada, was almost engulfed by flames in mid-August, forcing a three-week-long evacuation order.
The year’s total fire coverage in Canada of about 45 million acres was more than twice the previous national record, from 1995, and more than six times the yearly average over the past decade, affecting some 5% of Canada’s forest entire cover. By itself, it was more than enough to push the combined U.S./Canada fire coverage into record territory for data going back to 1983. Many parts of our warming planet — including western North America — have become more fire-prone as rising temperatures more effectively parch the landscape when drought sets in. Increased settlement in the wildland-urban interface is also adding to the threat.
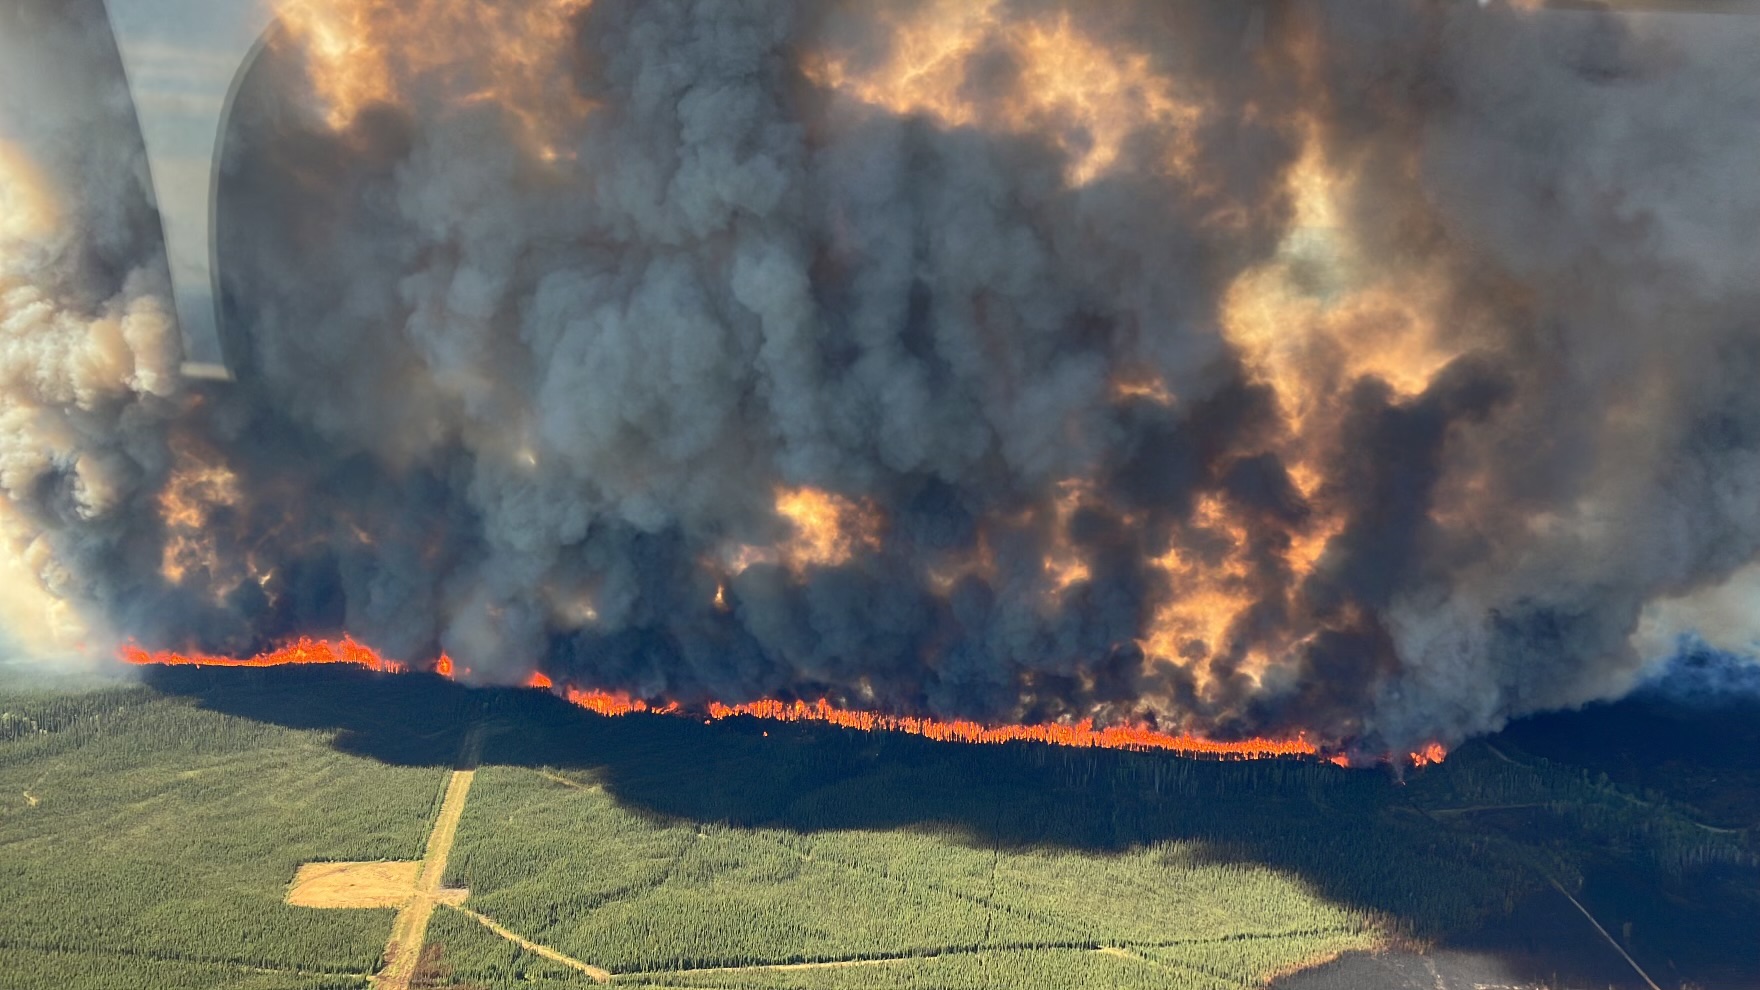
Aerial view of the Donnie Creek wildfire in northeastern British Columbia in May 2023. The massive blaze ripped across more than 1.44 million acres of land throughout the late spring and summer, making it the largest wildfire on record for the Canadian province. BC Wildfire Service
5. Twenty-eight hours before Cat 5 Hurricane Otis hit Acapulco, the National Hurricane Center was forecasting a tropical storm.
Few tropical cyclones in modern times have been as grievously underestimated — by human forecasters and computer models — as Hurricane Otis before its catastrophic impact on Acapulco, Mexico. For days, it appeared Otis would probably move inland as a weak system or else weaken as it paralleled the coast, the two most common outcomes for tropical storms and hurricanes near the south-facing coastline of southern Mexico.
Instead, Otis intensified at blinding speed as it leveraged a pocket of very warm sea surface temperatures and an ideally placed bundle of jet-stream winds, factors that were difficult for models to fully capture. Still classified as a tropical storm less than 16 hours before landfall, Otis moved directly into Acapulco just after midnight on Oct. 25 as a Category 5 storm with sustained winds estimated at 165 mph. The National Hurricane Center forecast made just 28 hours prior to that had predicted landfall as a strong tropical storm with 70 mph winds. A preliminary peak gust of 205 mph was observed at Acapulco Bay.
Otis is the strongest and most damaging hurricane ever recorded along the Pacific coast of North America, as well as the planet’s second most devastating tropical cyclone of 2023 (Typhoon Doksuri in China was blamed for damages of $20 billion, according to Gallagher Re). The hurricane led to at least 50 fatalities (perhaps dozens more), and its damage is likely to end up in the $15-20 billion range. A month after the storm, the city was still reeling, as covered in this update by Pearl Marvell.
Otis didn’t arrive without notice — a hurricane watch was in effect more than 30 hours before landfall — but the city’s lack of experience with strong hurricanes likely left people and institutions underprepared. Another factor: The city’s high-rises were apparently built more for earthquakes than for hurricanes. According to engineer Michel Bruneau, exterior walls were often kept lightweight to reduce earthquake risk, which could have made the walls more vulnerable to getting shredded by Otis.
Otis’s peak winds increased by 110 mph in 24 hours, the second-highest intensification rate on record for the Western Hemisphere. One of the standout features of hurricanes in recent decades has been a trend toward more rapid intensification, particularly as hurricanes approach landfall.
6. Hurricane Hilary’s rains created a rare temporary lake in Death Valley National Park.
After peaking as a formidable Category 4 storm off the coast of western Mexico, Hurricane Hilary took a highly unusual northward track parallel to Baja California and made landfall at San Quintín, Mexico, as a weakening tropical storm. It then proceeded to maintain tropical-storm strength while moving overland into far southwest California, a once-in-a-generation event. The coastline from San Diego to north of Los Angeles was under its first tropical storm warning in modern records.
Powerful easterly winds reminiscent of a wintertime Santa Ana event pummeled the coastal mountains of Southern California, with gusts to 80-90 mph at Magic Mountain and Big Black Mountain. However, the vast bulk of Hilary’s destruction — more than $600 million in insured damage — came from torrential rains across the western United States. Hilary delivered the wettest summertime calendar day ever recorded in downtown Los Angeles (2.48 inches), downtown San Diego (1.42 inches), and Palm Springs (3.18 inches).
And at Death Valley National Park, the Furnace Creek station got its wettest calendar day observed at any time of year: 2.2 inches, just above the site’s annual average. The park was closed for nearly two months, and runoff from Hilary that coursed into the park’s Badwater Basin — at 282 feet below sea level, one of the lowest spots on Earth — created a rare temporary lake that was still evident into early December.
Hilary went on to drench the northwest United States as a post-tropical cyclone. The storm is the only named system to hold records in four U.S. states for the largest storm-total rainfall from a single tropical cyclone or its remnants:
- Idaho: 2.99 inches, Dollarhide Summit (old record 2.05 inches from Kathleen, 1976)
- Montana: 2.3 inches, Albro Lake, Carrot Basin (old record 1.89 inches from Kathleen, 1976)
- Nevada: 9.21 inches, Lee Canyon (old record 4.36 inches from an unnamed system, 1906)
- Oregon: 3.29 inches, Morgan Mountain (old record 1.35 inches from Kathleen, 1976)
7. The sea surface temperature hit 101.1°F on July 24 in Manatee Bay, Florida.
Taking a dip in the hot ocean waters in and near the Florida Keys and Everglades in late July would have resembled a hot tub experience. High pressure was unusually strong across and near the eastern Gulf of Mexico during much of the summer, which kept surface winds light and suppressed rainfall. Both factors reduced the normal mixing that stirs up the topmost layer of Gulf water, which in turn allowed the sea surface to warm to phenomenal levels (further aided by sediment that can float near the top and absorb heat). Manatee Bay notched what appears to be the warmest reliable reading of the summer: 101.1 degrees Fahrenheit at a depth of five feet.
It wasn’t the warmest sea surface temperature ever observed at Manatee Bay — that dubious honor goes to 102°F on Aug. 15, 2017 — but the scorching reports from 2023 exemplified what’s been a record-smashing period for ocean surface temperatures across the planet. Globally averaged sea surface temperatures first broke all-time records in late March, topping 21 degrees Celsius for the first time. As shown above, analyses from ClimateReanalyzer.org show that globally averaged sea surface temperatures from April into December ran far above all other years in data going back to 1981. Since year-to-year swings in sea surface temperature are more muted than those for global air temperature, the planet’s ocean surface averaged worldwide was likely warmer in 2023 than it’s been for hundreds if not many thousands of years.
Hand in hand with the blazing oceans, global surface air temperature (including both terrestrial and oceanic areas) soared to new monthly record highs in every month from June through November. The annual average for 2023 is virtually certain to be the highest in records and analyses dating back to 1850.
8. Typhoon Doksuri was almost twice as costly as any other typhoon on record in China.
Typhoon Doksuri, the strongest on record to hit China’s Fujian province, made landfall there on July 28. According to Gallagher Re, the damage was at least $20 billion, making Doksuri the costliest typhoon in Chinese history, surpassing the $12 billion cost of Typhoon Lekima in 2019. According to EM-DAT, the international disaster database, the only costlier typhoon on record in the entire Northwest Pacific was Typhoon Mireille of 1991, which caused $22 billion in damage to Japan (in inflation-adjusted dollars).
Doksuri killed at least 80 people in China and 47 in the Philippines. The remnants of Doksuri dumped 744.8 mm (29.32 inches) of rainfall in Beijing over five days, setting an all-time precipitation record for the capital region since record-keeping began during the Qing dynasty in 1883. It’s also quite a bit more than Beijing typically experiences in an entire year: the city’s annual average from 1991 to 2020 was 20.78 inches.
9. Somalia lurched from catastrophic drought to deadly flooding in less than a year.
As the Eastern Pacific switched this year from a multiyear La Niña event to the strong El Niño event now underway, rainfall patterns made a U-turn in some parts of the world. The reversal was especially dramatic in hard-hit Somalia. During the unusually protracted La Niña conditions, eastern parts of the Horn of Africa region (Ethiopia, Kenya, and Somalia) experienced their most prolonged drought in records going back to 1950. In Somalia alone, the drought led to 43,000 excess deaths from 2021 through 2022, according to a February 2023 study by the London School of Hygiene & Tropical Medicine. The study warned that the rate of fatalities could rise and predicted an additional 18,100-34,200 drought deaths in Somalia during the first half of 2023. If this estimate proves correct, then the Somalia drought will be the deadliest weather-related disaster of 2023.
An analysis from World Weather Attribution released April 27 found that the October-to-December “short rains” have been getting wetter over time, even with La Niña’s drying influence taken into account, while the March-to-May “long rains” (which are uncorrelated with La Niña) have been getting drier. The extremity of drought impacts produced by low rainfall plus heat-induced landscape drying in 2021-2022 was far more severe in today’s climate than in the preindustrial climate, the study found, mainly due to the long-term warming of 1.2°C. “A conservative estimate is that such droughts have become about 100 times more likely,” the report added. It also noted that climate change is expected to intensify drought impacts as well as flood-producing rains in the region: “Taken together, regional climate variability and the projections indicate the need to invest in adaptation strategies that are robust to both wet and dry extremes.”
Late in 2023, as La Niña segued into El Niño, rain finally arrived — but too much of it — to parts of the Horn of Africa, including up to four times the average October-November rainfall. By late November, the most widespread and destructive floods in more than 20 years had led to nearly 100 deaths in Somalia and 76 deaths in Kenya. Almost 700,000 people in Somalia were displaced, according to the Famine Early Warning Systems Network. A Dec. 7 analysis from World Weather Attribution found that the exceptional intensity of the rains could be attributed in roughly equal parts to human-induced climate change and to a strong positive phase of the Indian Ocean Dipole, a naturally occurring phenomenon similar to the El Niño–Southern Oscillation.
10. Severe drought may have helped push Argentina into uncharted electoral waters.
In South America, a severe multiyear drought brought damages of over $16 billion to Argentina, Brazil, and Uruguay. Based on historical disaster costs at EM-DAT, the 2023 drought damages in Argentina ($9.2 billion) and Uruguay ($1.3 billion) would set all-time records as these nations’ most costly weather-related disasters. Accompanying the drought in late January and early February was a record heat wave, which brought Chile its deadliest wildfires on record (26 killed). Chile’s previous deadliest wildfire season was 2014, with 12 deaths. An analysis from World Weather Attribution released on Feb. 16 found that while the low rainfall in this drought was a product of natural variability and thus not related to human-caused climate change, “consequences of drought are becoming more severe due to the strong increase in extreme heat.”
The drought’s massive impact on agriculture in Argentina fed into other economic woes besetting the nation, including a severe monetary crisis that has pushed inflation rates above 100% over the last two years. The drought also posed major problems for foreign exchange, according to the Council on Foreign Relations. A Barron’s article published just days before Argentina’s presidential runoff on Nov. 19 spotlighted an array of farmers disgruntled by what they saw as a grim economic and regulatory picture. The ultimate winner of the presidential runoff was Javier Milei — a far-right libertarian and self-described anarcho-capitalist, known for brandishing a chain saw at rallies, who was dubbed by El País as “a mixture of a messianic preacher and a rock star.”
Bob Henson, a meteorologist and science writer based in Colorado, is the author of “The Thinking Person’s Guide to Climate Change” (AMS Books). He is a contributing editor of Texas Climate News.
Jeff Masters, like Henson a regular contributor to Yale Climate Connections, was a hurricane scientist with the NOAA Hurricane Hunters from 1986-1990 and co-founded Weather Underground.