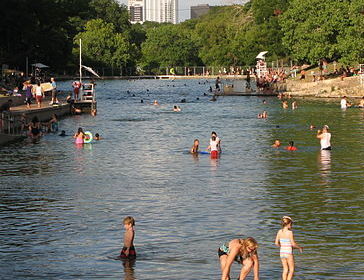
Chilly Barton Springs Pool has long provided relief from Austin's summer heat, which is projected to grow more intense with climate change.
Last Friday, a report on Weather.com provided yet another reminder that there will be dramatic short-term departures from the average global warming trend that scientists say pollution is causing: “Temperature records set way back in the 1880s have been broken as unusually cool air is blanketing a large part of the country in the heart of summer.”
Over at the Guardian’s website, meanwhile, that British newspaper’s story on a “U.K. heatwave alert” issued last week by forecasters at the country’s Met Office included some context relevant to the cooler situation that existed in much of the U.S., too: “This year the world experienced the hottest May globally since records began in 1880. The heat, combined with increasingly certain predictions of an El Niño weather event, means that experts are now speculating whether 2014 could become the hottest year on record.”
Whether the current year does or doesn’t achieve that distinction, scientists almost universally expect hotter conditions overall as coming decades unfold.
A thought-provoking new report from Climate Central, a non-profit scientific research and journalism organization, sought to illustrate what that’s expected to mean in 1,001 U.S. cities.
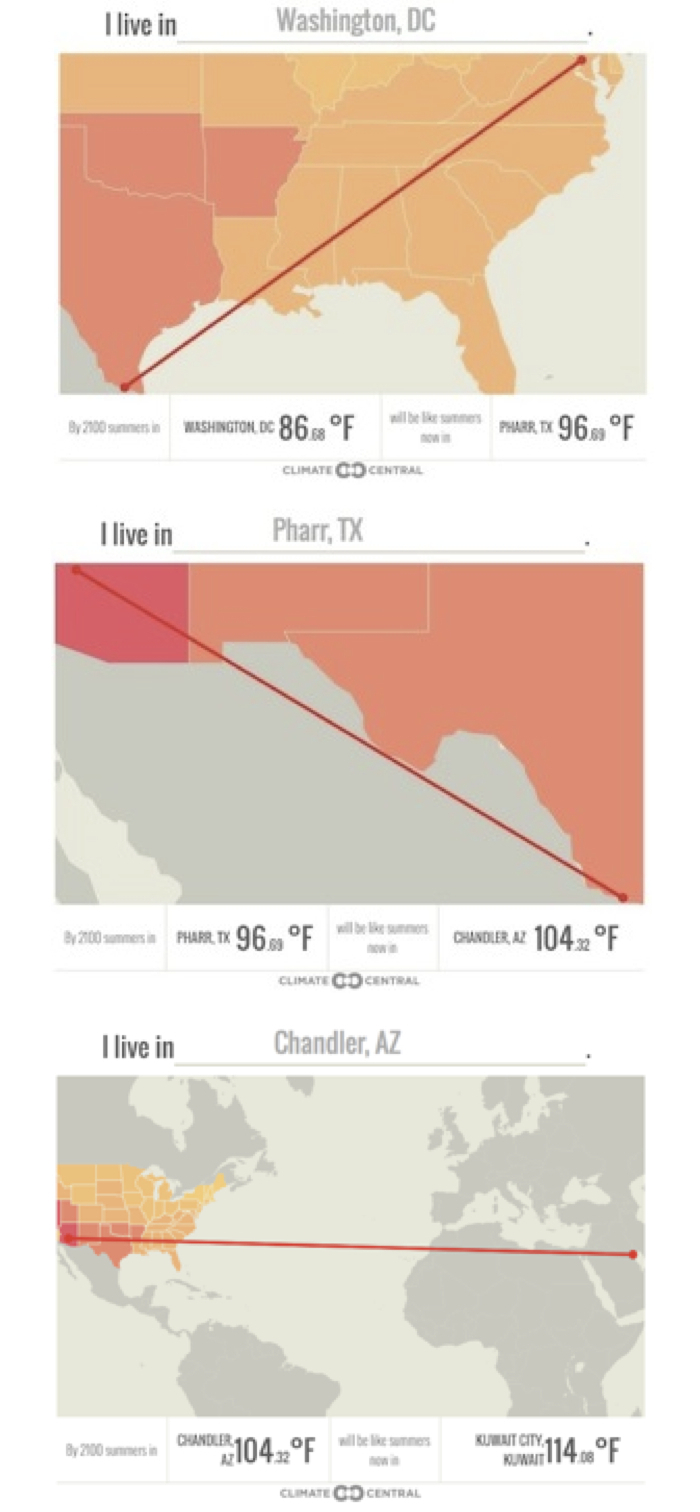
The report included an interactive graphic (reproduced with permission below this paragraph) that lets users find out a given city’s current average high summer temperature, its projected summer-high average at the end of the century, and the identity of another city (in the U.S. or elsewhere) whose current summer-high average matches that projection. [Enter a city’s name or click on the map.]
Climate Central’s study, based on projections from the Intergovernmental Panel on Climate Change used different greenhouse-gas-emission scenarios, presenting the 1,001 cities’ end-of-century projections for a “business as usual” scenario based on current greenhouse-gas-emission trends. The organization’s summary had a prominent Texas angle, playing off the state’s already-hot reputation:
By the end of the century, assuming the current emissions trends, Boston’s average summer high temperatures will be more than 10 degrees Fahrenheit hotter than they are now, making it feel as balmy as North Miami Beach, Fla., is today. Summers in Helena, Mont., will warm by nearly 12 F, making it feel like Riverside, Calif.
In fact, by the end of this century, summers in most of the 1,001 cities we analyzed will feel like summers now in Texas and Florida (in temperatures only, not humidity). And in Texas, most cities are going to feel like the hottest cities now in the Lone Star State, or will feel more like Phoenix and Gilbert in Arizona, among the hottest summer cities in the U.S. today.
Images generated by Climate Central’s interactive graphic depict three interrelated changes, affording a city-based snapshot of the way that the world is projected to heat up: Washington, D.C. at century’s end will have average summer high temperatures like those today in the South Texas city of Pharr. The average summer high in Pharr will be like Chandler, Arizona’s today. And Chandler’s average high in the summer will match what Kuwait City in the Arabian Peninsula experiences now.
The report authors emphasized that the numbers in the interactive graphic only portray average high temperatures that were projected to result from a continuing warming trend, calculated on the basis of growing greenhouse emissions in recent decades.
This analysis only accounts for daytime summer heat – the hottest temperatures of the day, on average between June-August – and doesn’t incorporate humidity or dewpoint, both of which contribute to how uncomfortable summer heat can feel. This projected warming also assumes greenhouse gas emissions keep increasing through 2080, just as they have been for the past several decades.
In addition to that emissions scenario, which involves “largely unabated” growth in emissions, the analysts prepared projections for several U.S. cities, based on other IPCC scenarios:
RCP6 sees emissions continue to grow, until about 2060, after which time they decrease and then stabilize (though overall greenhouse gas concentrations in the atmosphere will continue to grow under this scenario). RCP4.5 sees emissions stabilize over the next twenty years, and then decrease. RCP2.6 assumes drastic climate policy intervention that leads to rapidly decreasing emissions beginning in 2020.
Even with these moderate-to-dramatic emissions cuts characteristic of RCP2.6, RCP4.5, and RCP6, U.S. cities are already locked into some amount of summer warming through the end of the century.
Austin, where the current average summer high temperature is 94.3 F, was one of the cities with projections for those additional emission-cutting scenarios. With “largely unabated” emissions, its average high was projected to reach 102.8 (the level in Gilbert, Arizona today). With increasingly strict emission cuts in the three additional scenarios, Austin’s summer averages high were projected to match current summer averages in Laredo (99.2 F), Mission (98.6) and Pharr (96.8) around the end of the century.
“Old averages” versus “new realities”
Earlier this month, meanwhile, Reuters reported that because of global warming that has already occurred and continues, the U.N.’s World Meteorological Organization doesn’t want to wait till then to start making more frequent changes in the “baseline for ’normal’ weather used by everyone from farmers to governments to plan ahead.”
“For water resources, agriculture and energy, the old averages no longer reflect the current realities,” Omar Baddour, head of the data management applications at the WMO, told Reuters.
A government trying to decide where to build river flood defenses or a hydroelectric dam based on average rainfall could be misled by the 1961-90 data, for example, while a farmer studying average temperatures might plant crops that wilt in warmer conditions, he said.
Under current rules, the 1961-90 baseline is due to be updated in 2021, with the data from 1991-2020. The Commission for Climatology wants to see rolling updates every decade, making the current baseline 1981-2010 and the next period 1991-2020.
The Texas Water Development Board drew criticism from climate scientists for not factoring manmade climate change into the water-needs projections in the 2007 edition of its Texas Water Plan. As TCN subsequently reported, the 2012 plan – the most recent version – departed slightly from the 2007 plan’s insistence that accounting for climate change was “unnecessary.”
In contrast to the 2007 plan’s declaration that it was “unnecessary to plan for [climate change] specifically,” the 2012 draft has this advice for regional water planners:
Until better information is available to determine the impacts of climate change on water supplies and water management strategies evaluated during the planning process, regional water planning groups can continue to use safe yield (the annual amount of water that can be withdrawn from a reservoir for a period of time longer than the drought of record) and to plan for more water than required to meet needs, as methods to address uncertainty and reduce risks. TWDB will continue to monitor climate change policy and science and incorporate new developments into the cyclical planning process when appropriate. TWDB will also continue stakeholder and multi-disciplinary involvement on a regular basis to review and assess the progress of the agency’s efforts.
Elsewhere, the authors report that most planning regions base estimates on “firm yield,” the maximum water a reservoir can provide annually in conditions equal to the 1950s drought of record. But some use “safe yield,” which “allows a buffer to account for climate variability, including the possibility of a drought that might be worse than the drought of record.”
In the regional plans that went into the 2012 draft, planning groups in six of the 16 regions planned for a drought worse than the drought of record with changes in the assumptions involved in water-availability projections.
However, scientists continue to say the state’s approach to water planning includes insufficient attention to climate projections that the vast majority of experts endorse – in Texas and around the world. The Texas Tribune reported this month:
“Climate change will affect water supply by 5 to 15 percent in the next 50 years,” said John Nielsen-Gammon, the state climatologist and a professor at Texas A&M University. “I don’t think [the effects] are small enough to ignore.”
Nielsen-Gammon and other scientists say higher temperatures due to global warming are already diminishing water resources, and that climate change will cause the southern and western portions of the state to become drier. Those regions supply water for fast-growing cities like Austin and San Antonio, as well as the Rio Grande Valley.
Last month, in an interview with the Environmental Defense Fund’s Texas Clean Air Matters blog, Nielsen-Gammon cited water-supply matters when he was asked to identify his “key concerns” regarding the impacts of climate change on Texas:
For ecology, there are multiple threats to coastal ecosystems. Ocean acidification, sea level rise, reduced freshwater inflows, and rising temperatures will combine to lead to major changes. For society, there are lots of little problems. The most costly and pervasive would be reduced water availability, while the most dangerous would be increased chances of urban wildfires.
– Bill Dawson

