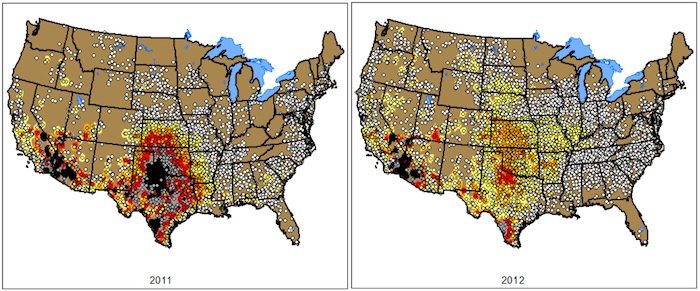
Texas was the epicenter for temperatures that reached or exceeded 100 F in 2011. Such readings were more widespread in 2012. White dots represent 1-10 days over 100; yellow, 10-25; orange, 26-40; gray, 56-70, and black, 70 or more.
Last year was the warmest on record in the contiguous 48 states, and Texas played its part in setting that record, according to an analysis by federal climate scientists.
The record-setting average temperature across the contiguous U.S. was 3.2 degrees Fahrenheit above the 20th century average, according to a report issued Tuesday by the National Oceanic and Atmospheric Administration.
The same report showed that Texas’ average temperature in 2012 was tied with its own 1921 average to make them the two warmest years in 118 years of record-keeping (since 1895) – both years at 2.4 F above the state’s longterm average.
Many Texas cities were exceptionally warm, according to the NOAA report. Of the 13 Texas cities that appear on its list of about 180 selected cities across the nation that have longterm weather stations, nine set or tied with their own records for their highest annual averages.
Those nine cities, listed here with the number of degrees above their own 1981-2010 average temperatures, stretched from the Panhandle in the north to the southernmost tip of the state and from Southeast Texas to El Paso on the state’s western end:
- Abilene (+3.3 F)
- Amarillo (+4.0 F)
- Brownsville (+2.8 F)
- Corpus Christi (+3.7 F)
- Dallas (+2.8 F)
- Del Rio (+2.7 F)
- Houston (+2.5 F)
- Lubbock (+2.9 F)
- Midland (+3.2 F)
In addition, El Paso had its second-warmest year (+2.6 F), Austin and San Antonio had their third-warmest years (+2.3 F and +2.2 F, respectively) and Wichita Falls had its eighth-warmest (+3.1 F).
Of the four states that border Texas, New Mexico (+2.7 F) and Oklahoma (+3.4 F) had their warmest years on record, Arkansas had its second-warmest (+ 2.7 F) and Louisiana its sixth-warmest (+2.1 F)
The largest cities in each of those states had their own warmest recorded temperature averages – Albuquerque (+2.8 F), Oklahoma City (+2.7 F), Little Rock (+ 3.2 F) and New Orleans (+2.2 F).
NOAA offered this explanation of the national temperature record and associated drought that gripped much of the nation:
Although the last four months of 2012 did not bring the same unusual warmth as the first eight months of the year, the September-through-December temperatures were warm enough for 2012 to remain the record warmest year, by a wide margin.
The average precipitation total for the contiguous U.S. for 2012 was 26.57 inches, 2.57 inches below average, and the 15th driest year on record for the nation.
The U.S. Climate Extremes Index indicated that 2012 was the second most extreme year on record for the nation. The index, which evaluates extremes in temperature and precipitation, as well as landfalling tropical cyclones, was nearly twice the average value and second only to 1998.
The geographic extent of extreme conditions “was 19 percent greater than the historical average and the second largest extent in combined extremes on record (since 1910),” the NOAA report elaborated. “This record extent of extremes was primarily the result of extremes in warm maximum and minimum temperatures as well as large areas of dryness, as denoted by the Palmer Drought Severity Index.”
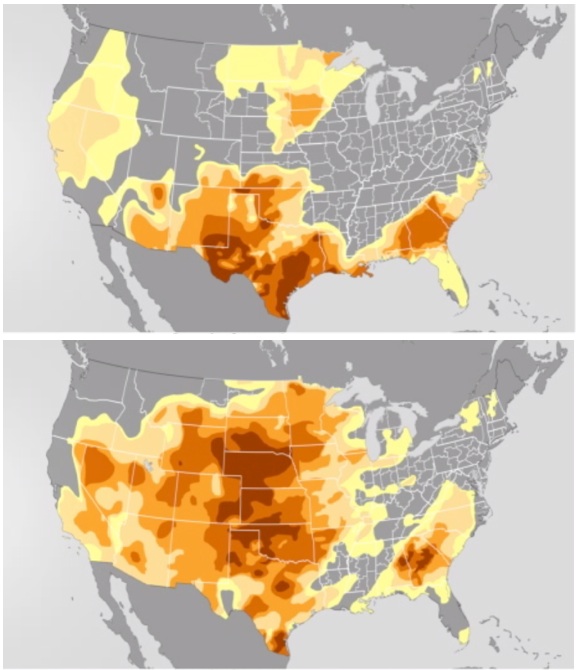
As news reports documented throughout 2012, drought conditions that had centered in Texas in 2011 extended to most of the rest of the nation last year while the Texas drought receded and moderated somewhat.
Writing on his blog last week in anticipation of Tuesday’s NOAA report, John Nielsen-Gammon, the Texas state climatologist, explained how 2012 could rank as a warmer year than 2011 in Texas, with that year’s memorably uncomfortable and record-setting summer temperatures:
Everyone remembers the record-setting heat of the summer of 2011. Harder to remember is that January, February, and December of 2011 were all cooler than normal. [The previous record-setting year of] 1921 had a near-normal summer, but the cooler half of the year was consistently warmer than normal. In 2012, the warmth was spread out almost uniformly. Eleven of twelve months recorded above-normal temperature, with October being the sole exception.
These temperatures are also part of a long-term pattern, in this case warming by almost 1.5 F since the 1970s.
Last year, despite above-normal precipitation through September, Texas recorded another drought year, extending the more extreme and damagingly dry conditions of 2011, Nielsen-Gammon wrote:
The final three months of 2012 were the third-driest October-December on record for Texas. Drought spread, and Galveston even had to impose water restrictions, although restrictions on outdoor watering aren’t much of a problem this time of year.
With the year ending up with below-normal precipitation, the combined two-year period 2011-2012 was the fourth-driest on record, beaten only by 1916-1917, 1955-1956, and 1909-1910.
The latest Texas drought map, posted online last Thursday by the U.S. Drought Monitor, showed that nearly all of Texas remained in drought conditions of varying severity, with most of the remainder “abnormally dry,” but not officially qualifying as drought.

Drought's spread: The top map, showing drought conditions at the start of 2012, and bottom map, which shows the end of the year, illustrate the spread of drought conditions across much of the U.S. during those 12 months. Darker colors represent greater drought severity.
The Climate Prediction Center of the National Weather Service, meanwhile, has forecast warmer-than-average temperatures across all of Texas from January through March. It also forecast above-normal precipitation in the western third of the state, with equal chances of average, below- and above-average precipitation elsewhere.
The center’s seasonal drought outlook, however, also forecast that drought conditions will “persist or intensify” across roughly three-fourths of Texas through March. Drought was expected to develop anew or lessen somewhat in most of the rest of the state.
– Bill Dawson
Image credits: National Oceanic and Atmospheric Administration
