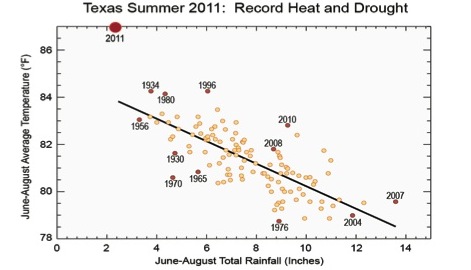
Off the chart: The new National Climate Assessment contains numerous references to Texas' record-setting heat and drought in 2011. Those harsh conditions – the large red dot on this chart – "represent conditions far outside those that have been registered since the instrumental record began" in the 19th century, the report says. "Generally," it adds, "the changes in climate are increasing the likelihood for these types of severe events."
By Bill Dawson
Texas Climate News
Expert authors: 240. Number of pages: 1,146.
Those two numbers convey a sense of the scope of the scientific effort that went into a new federally-comissioned report on climate change, issued last month in draft form. The study “collects, integrates, and assesses observations and research from around the country, helping to show what is actually happening and what it means for peoples’ lives, livelihoods, and future.”
The first paragraph of the National Climate Assessment – the first updated edition of that congressionally-ordered study in four years – conveys a sense of its sweeping findings:
Climate change is already affecting the American people. Certain types of weather events have become more frequent and/or intense, including heat waves, heavy downpours, and, in some regions, floods and droughts. Sea level is rising, oceans are becoming more acidic, and glaciers and arctic sea ice are melting. These changes are part of the pattern of global climate change, which is primarily driven by human activity.
Katharine Hayhoe, director of the Climate Science Center at Texas Tech University and a lead author of one chapter in the report, told the Associated Press: “There is so much that is already happening today. This is no longer a future issue. It’s an issue that is staring us in the face today.”
And it will continue to do so in coming years and decades, the report stresses:
Human-induced climate change is projected to continue and accelerate significantly if emissions of heat-trapping gases continue to increase. … Climate change threatens human health and well-being in many ways, including impacts from increased extreme weather events, wildfire, decreased air quality, diseases transmitted by insects, food, and water, and threats to mental health.
What does – and will – it mean for Texas? The report has no single, comprehensive, state-level appraisal, per se, but one way to get a general idea of what it says on that question is to glean it from maps and other graphics that illustrate many of the key conclusions and projections included by the authors.
TCN reviewed the report’s 1,146 pages to assemble this selection of graphics with Texas-related information. (Captions beneath the graphics reproduced below also appear in the report.)
+++ Temperature +++
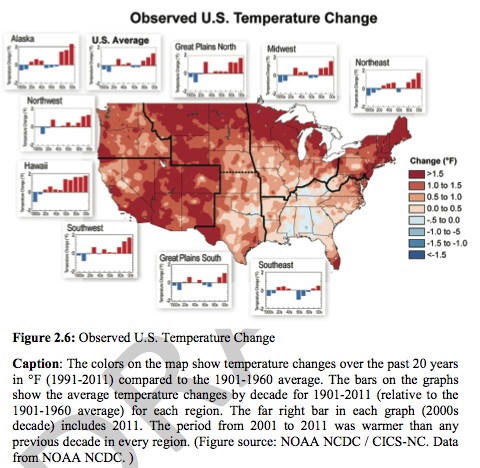
U.S. temperature change: 1991-2011 vs. 1901-1960
Most of Texas has been growing warmer over the past two decades – less so than many parts of the country, but more than some Southeastern states.
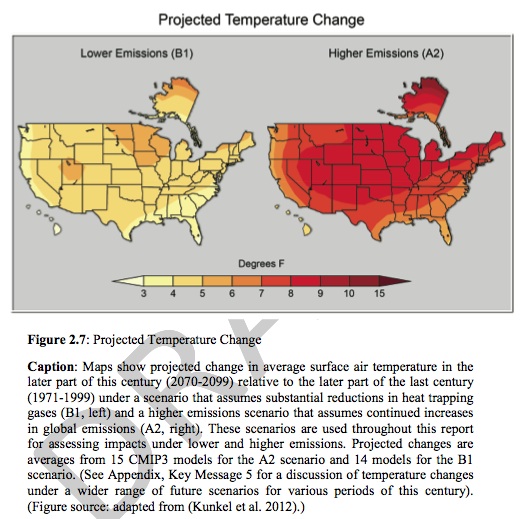
Temperature projection: 2070-2099
In the 2070-2099 period, compared to 1971-1999, average surface air temperatures in Texas are projected to be 3 to 5 degrees F warmer if there are “substantial reductions in heat trapping gases” and 6 to 9 degrees F warmer in a higher-emission scenario.
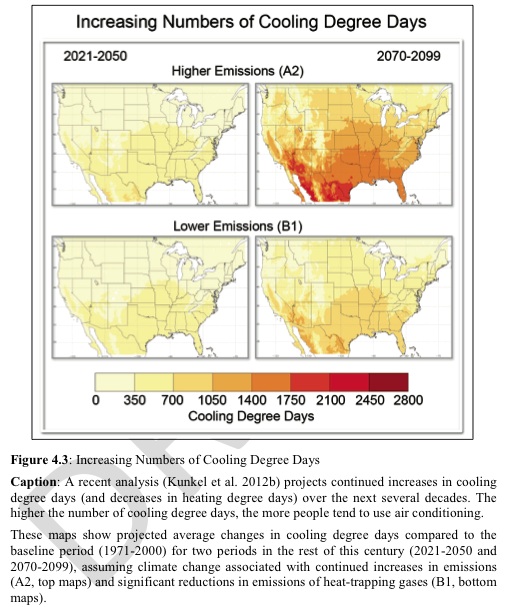
More AC-conducive days
Texans use a lot of air conditioning already. A study projected a considerably greater increase in the state in “cooling degree days” (when people tend to use air conditioning) with higher emissions of greenhouse gases.
+++ Drought and water +++
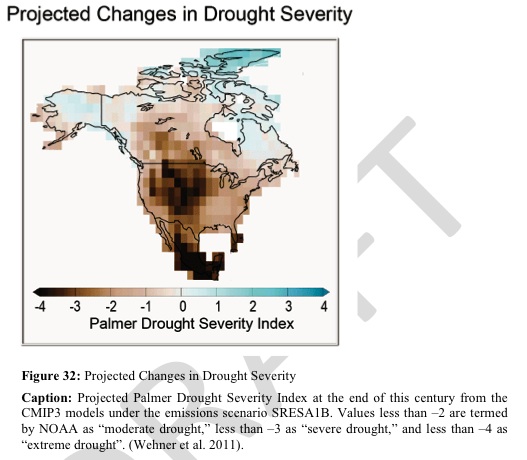
Drought severity
Droughts would grow more damaging in Texas under this 2011 projection, though not by as much as in parts of Mexico and in areas of the U.S. to the north and northwest of the state. Lower numbers on the standard Palmer Drought Severity Index indicate drier conditions.
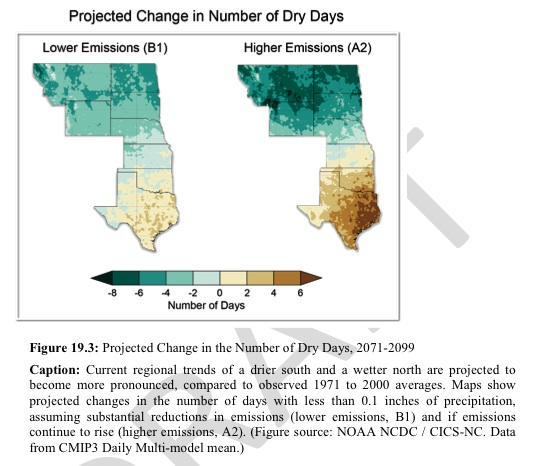
“Dry days”
In a contrast with Plains states to the north, Texas is projected to experience more “dry days” – those with less than a tenth of an inch of precipitation – more so if greenhouse emissions continue to rise (map at right) than in a scenario with “substantial reductions.”
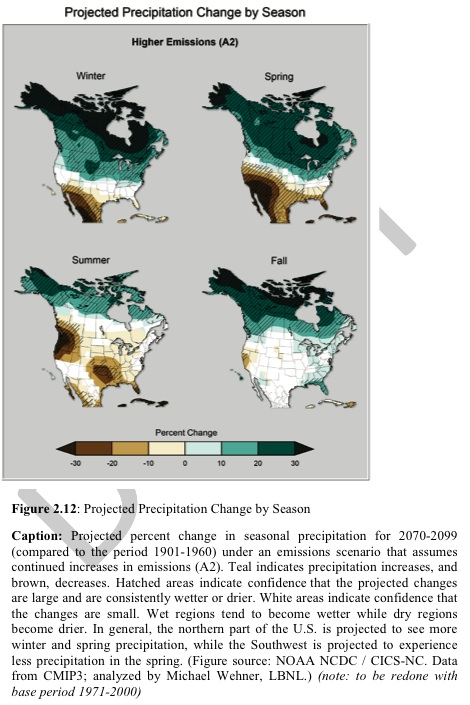
Precipitation: 2070-2099
With increased greenhouse emissions, Texas will get generally drier, according to projections illustrated on these maps. Precipitation changes are projected to vary by season in Texas in the last decades of this century, compared to a 1901-1960 baseline. Shades of brown represent decreases in precipitation and shades of teal indicate increases.
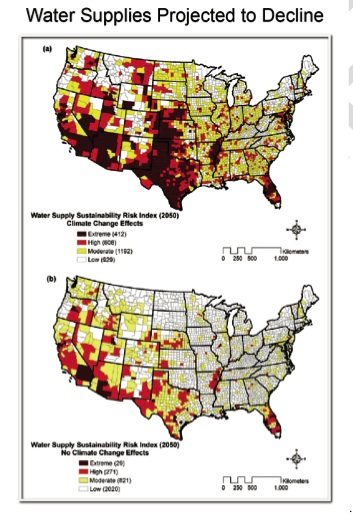
Declining water supplies
Even without climate change (bottom map), water supplies are projected to decline by 2050, according to a Water Supply Sustainability Risk Index. With climate change (top map), most of the state has either “extreme” (dark red) or “high” (bright red) declines.
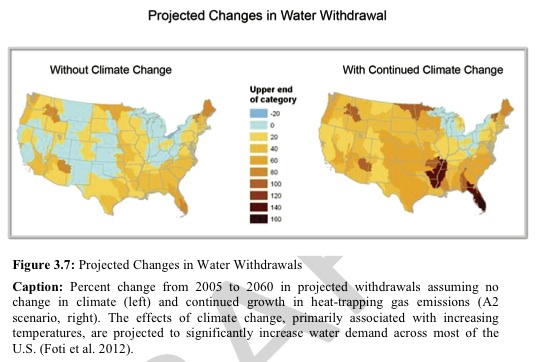
Increase in water demand
Water demand (“withdrawal”) is projected to increase across most of Texas without climate change (left map) and across the entire state with continued growth in heat-trapping pollution and resulting climate change (right map).
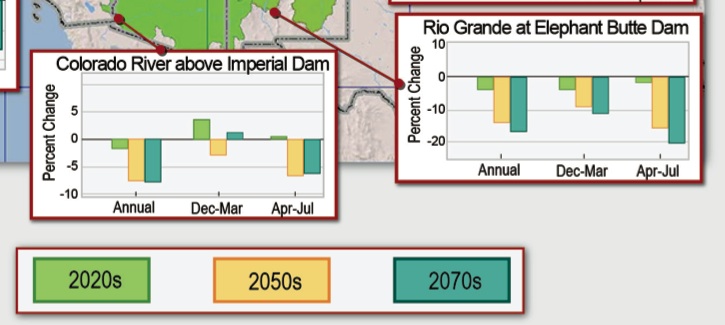
Declining Rio Grande flows
Projected declines in stream flows on the Rio Grande, upstream from the place where it forms the Texas-Mexico border at El Paso, has implications for people living on both sides of that border, where irrigated agriculture and growing urban populations rely on river water.
+++ Agriculture and horticulture +++
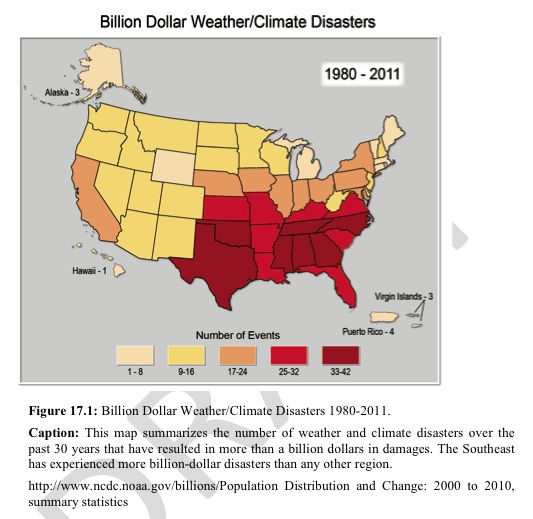
Billion-dollar disasters
Texas, along with neighboring Oklahoma and five Southeastern states, led the nation in terms of billion-dollar “weather/climate disasters” over a 31-year period. The cost of the 2011 drought to Texas agriculture was nearly $8 billion, according to experts at Texas A&M University.
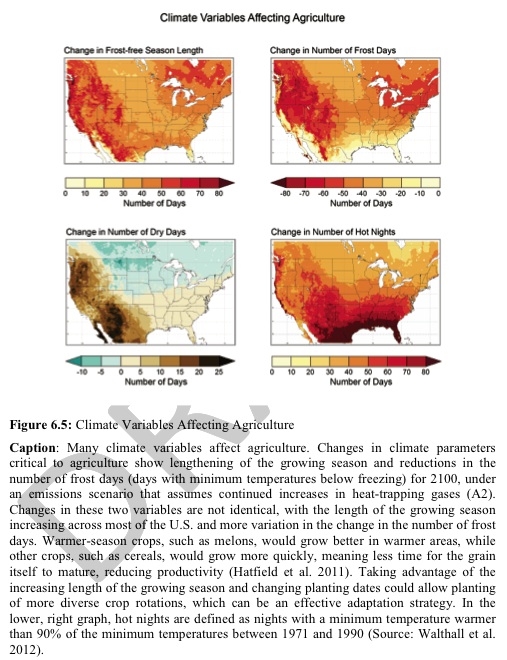
Climate’s impact on agriculture
With continued heat-trapping emissions, one study projects a longer growing season for Texas agriculture but also more dry days and hot nights.
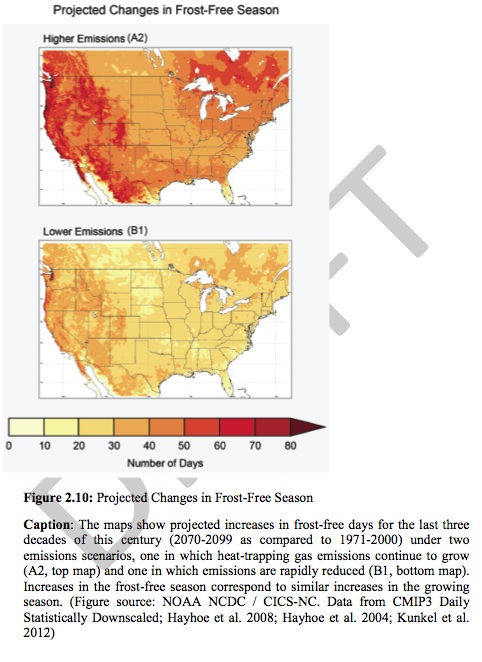
Frost-free season
Higher levels of greenhouse emissions (top) are projected to bring bigger increases in the numbers of frost-free days in Texas and elsewhere across North America. (“Frost-free season” is synonymous with “growing season.”) Reduced frost days “can result in early bud-bursts or blooms, consequently damaging some perennial crops,” the report adds.
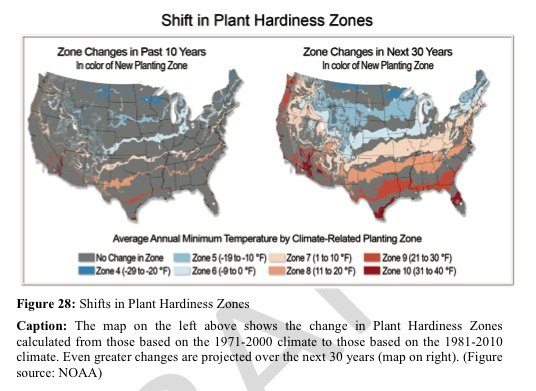
Plant-hardiness zones
Greater changes in “plant hardiness zones” are projected in the next three decades, compared to the changes recorded in the past 10 years.
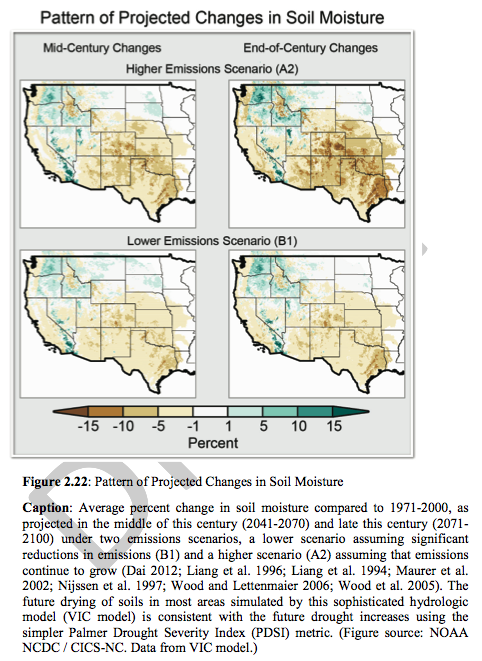
Declining soil moisture
Soil moisture is projected to decline in Texas under both lower emissions of greenhouse gases (bottom maps) and higher emissions (top maps). These projections are “consistent with future drought increases” that were projected using a different scale, according to the report.
+++ Hurricanes, tropical storms and sea-level rise +++
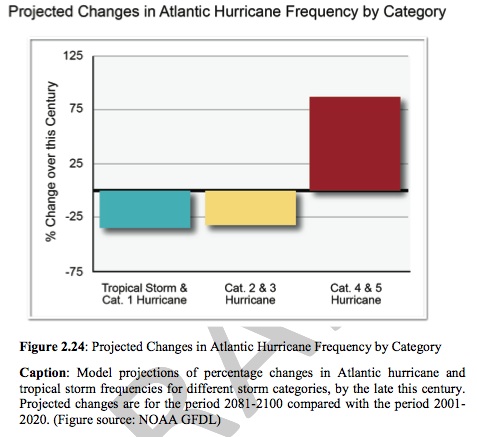
Atlantic hurricane frequency
The strongest hurricanes (red bar) are projected to increase as manmade climate change progresses, while other hurricanes (some still very strong) and tropical storms are projected to decrease in number.
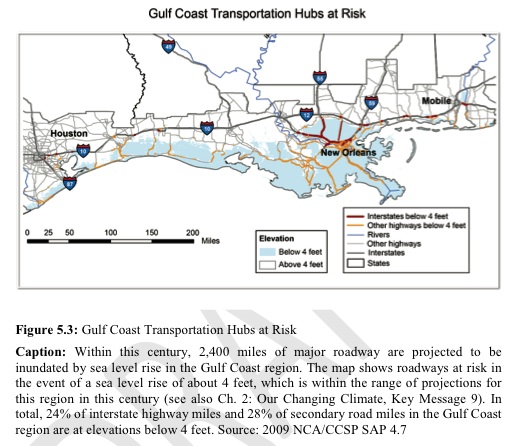
Gulf Coast roadways
A sea-level rise of 4 feet, with the projections range for the Houston-Mobile section of the Gulf Coast, is expected to inundate roadways in blue areas.
Shoreline erosion
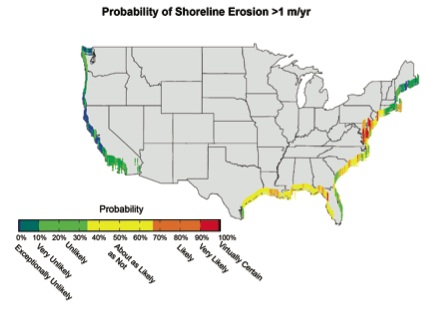
Along most of the Texas Coast, as along most of the Gulf Coast in general, annual shoreline erosion greater than a meter per year resulting from higher sea levels is projected to be in the range labeled “about as likely as not.”
+++ Public health +++
Ground-level ozone (AKA smog)
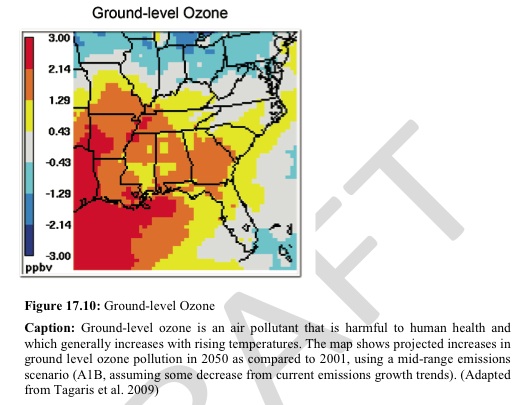
Texas has long struggled in some metro areas to reduce levels of ground-level ozone, a health-damaging gas that forms when certain air pollutants mix in sunlight. The eastern edge of the state – the only part shown on this map – is projected to experience greater increases in ozone levels as temperatures warm, compared to most other areas shown.
Shrinking tick habitat
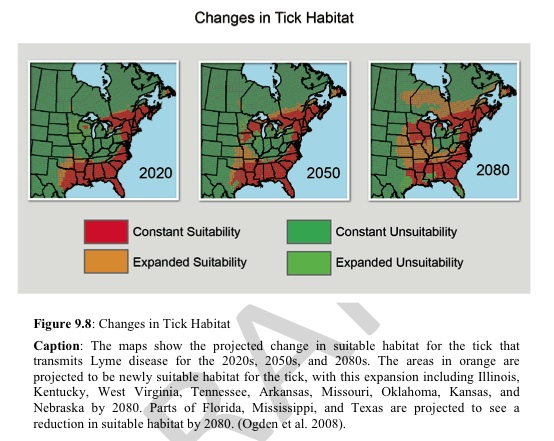
It wasn’t all worrisome news for Texas in the report’s graphics. The total area of the state classified as suitable for ticks that transmit Lyme disease is projected to shrink from 2020 to 2080 as the climate changes.
[Disclosure: Robert Harriss, former president and CEO of the Houston Advanced Research Center and currently a HARC distinguished fellow, was a lead author of one chapter in the new edition of the National Climate Assessment. HARC, a non-profit, non-partisan organization, publishes Texas Climate News. TCN is independently written and edited by journalists who are not HARC employees and make all editorial decisions without direction or influence by HARC, its funders or affiliates.]

