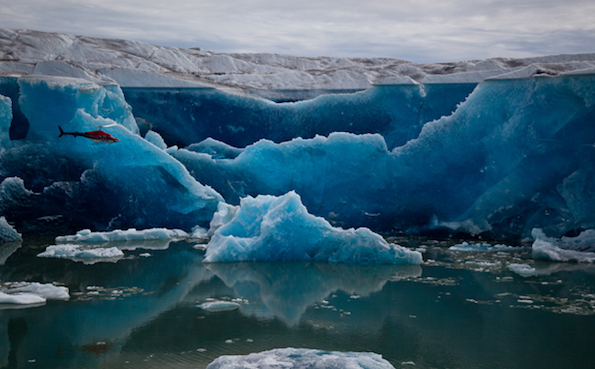
Meltwater lake near Helheim Glacier, Southeast Greenland.
By Bill Dawson
Texas Climate News
It’s that season once again when year-end attention turns to the frigid Far North. Tales of a toy workshop at the top of the world mix with thoughts of possible Arctic cold fronts bringing snow.
This year, the season comes soon after a flurry of recent studies and reports about the profoundly disruptive impacts that global warming is bringing to the Arctic ecosystem and neighboring regions.
Here’s a partial summary, which can serve as a guide for further reading about how the Arctic is “going through the most unprecedented transition in human history,” thanks to manmade climate change.
+++
Arctic Report Card
The Arctic Report Card, an annual report sponsored by the National Oceanic and Atmospheric Administration, documented various ways “that the warming trend transforming the Arctic persisted in 2017,” including the second warmest air temperatures ever recorded and the lowest winter sea-ice coverage on record.
Warming in the Arctic is occurring at about twice the rate of the rest of the planet, the report said.
“The Arctic is going through the most unprecedented transition in human history, and we need better observations to understand and predict how these changes will affect everyone, not just the people of the north,” Jeremy Mattis, director of NOAA’s Arctic Research Program, said when the report was released on Dec. 12.
“This year’s observations,” he added, “confirm that the Arctic shows no signs of returning to the reliably frozen state it was in just a decade ago.”
Some report highlights:
Air temperatures: Over land, the average was the second-highest on record, after 2016 – 2.9 degrees F (1.6 C) above the 1981-2010 average. Over seas, temperatures were up to 7.2 degrees F (4 C) above average, adding to delayed autumn “freeze-up” in some regions.
Sea ice: Maximum coverage (in December) was the smallest on record, while minimum coverage (in September) was the eighth-lowest. Each year, sea ice is also getting thinner, with more relatively young ice. Older, thicker ice made up just over a fifth of the ice cover this year. In 1985, it was 45 percent.
Plant life: “Pronounced increases” have been recorded in ocean plankton growth. On land, plants are getting larger and leafier, with shrubs and trees “taking over” what were previously grassland and tundra areas and “record permafrost warming.”
The Arctic Report Card, documenting “rapid and dramatic changes,” presents “a powerful argument for why we need long-term sustained Arctic observations to support the decisions that we will need to make to improve the economic well-being for Arctic communities, national security, environmental health and food security,” Timothy Gallaudet, the acting NOAA administrator and a retired Navy rear admiral, said upon the report’s release.
Gallaudet is a Trump administration appointee. Six days after he led the Arctic report’s release, the administration dropped climate change from the National Security Strategy’s list of the things it recognizes as global threats.
Coverage: Washington Post, InsideClimate News, AP, BBC, The Guardian
+++
Accelerating melt
One section of the Arctic Report Card focuses on the accelerating rate of change in some measurements:
“Paleo-reconstructions” of the Arctic climate in centuries before actual measurements – which scientists base on biological, physical or chemical proxies in geological records – “indicate that the magnitude and pace of the 21st century sea-ice decline and surface ocean warming are unprecedented in the last 1,500 years.”
This graphic from the report illustrates that point, showing, from top to bottom, increasing concentrations of heat-trapping carbon dioxide in the atmosphere, increasing air and sea temperatures, and the declining extent of sea ice. The vertical scored line at 1800 roughly marks the start of the Industrial Revolution, which accelerated human releases of CO2 from fossil-fuel use:
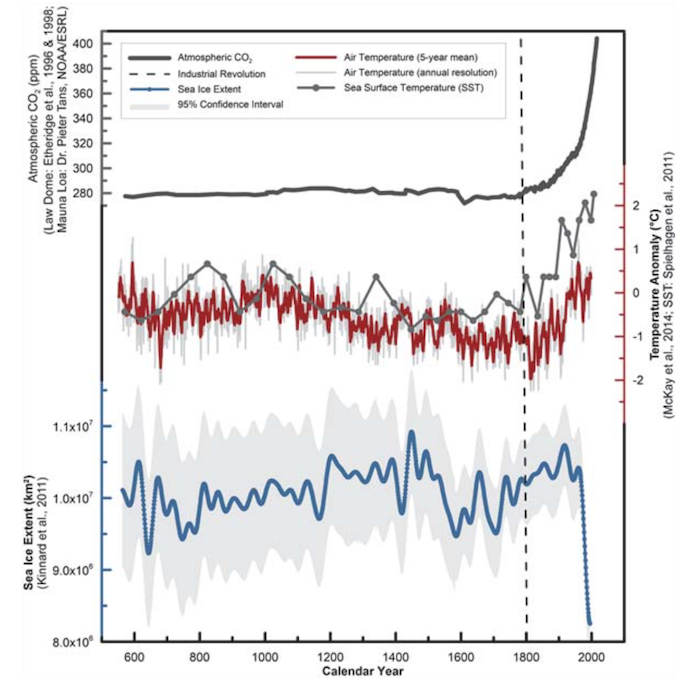
The steep plunge of the blue trend line on the sea-ice part of the chart represents “the largest magnitude decline in sea ice, and the greatest sustained rate in sea ice decline in that 1,500-year record,” Emily Osborne, a scientist who assembled the chart data at NOAA, told Vox.
The author of the same article added that the melting rate “seems to be getting worse very quickly: ‘This was the third straight year of a record low winter maximum,’ the report concludes.”
Melting of sea ice adds to overall global warming as it reveals darker, more heat-absorbent ocean waters. But as Vox noted, it doesn’t contribute to rising sea levels.
Something that does contribute to sea-level rise is melting from Greenland’s massive ice sheet. A day after the release of the Arctic Report Card, the journal Science Advances published a new study documenting an “abrupt shift” in runoff from Greenland to the ocean.
Scientists from Denmark and Greenland reported they had recorded an “abrupt 80 percent increase in that ice-sheet runoff between the 1976-2002 and 2003-2014 periods,” an increase “due to a shift in atmospheric circulation.”
This discovery establishes “the first observation-based connection between ice sheet runoff and climate change,” they wrote.
Vox published a detailed report on the Greenland study.
Worries about abrupt and calamitous melting of the ice sheet are not new.
A year ago, for example, scientists reported in the journal Nature that they had discovered that the Greenland ice sheet practically disappeared for an extended period in approximately the past million years.
“The finding casts doubt on assumptions that Greenland has been relatively stable during the recent geological past, and implies that global warming could tip it into decline more precipitously than previously thought,” Columbia University reported at the time of the study’s publication.
“Greenland contains about 684,000 cubic miles of ice – enough to raise global sea levels about 24 feet if it were to melt completely,” the university’s announcement noted.
+++
Permafrost problems
The Arctic Report Card reported that in 2016, “permafrost temperatures were the highest on record at the majority of Arctic observation sites.”
Since 2000, the report said, permafrost temperature increases have been greatest in the “cold [continuously frozen] permafrost” of the Alaskan Arctic, Canadian high Arctic and Norway’s Svalbard archipelago stretching from that country’s mainland to the North Pole.
Both the New York Times and Vox examined permafrost problems resulting from climate change in recent articles.
From the Times report:
Once this ancient organic material [frozen in permafrost] thaws, microbes convert some of it to carbon dioxide and methane, which can flow into the atmosphere and cause even more warming. Scientists have estimated that the process of permafrost thawing could contribute as much as 1.7 degrees Fahrenheit to global warming over the next several centuries, independent of what society does to reduce emissions from burning fossil fuels and other activities.
From the Vox article:
[Permafrost melting means] things are getting weird and creepy: The ground warps, folds, and caves. Roadways built on top of permafrost have becoming wavy roller coasters through the tundra. Long-dormant microbes — some trapped in the ice for tens of thousands of years — are beginning to wake up, releasing equally ancient C02, and could potentially come to infect humans with deadly diseases.
The Arctic Report Card reported that “recent long-term changes in permafrost temperature are driven mostly by the surface air temperature trends,” with other key factors like snow cover, vegetation and soil moisture not yet manifesting long-term trends at the regional level.
“In general,” the Report Card added, “the increase in permafrost temperatures observed since the 1980s is more substantial in the higher latitudes where the largest increase in surface air temperature is also observed.”
+++++
Bill Dawson is the founder and editor of Texas Climate News.