
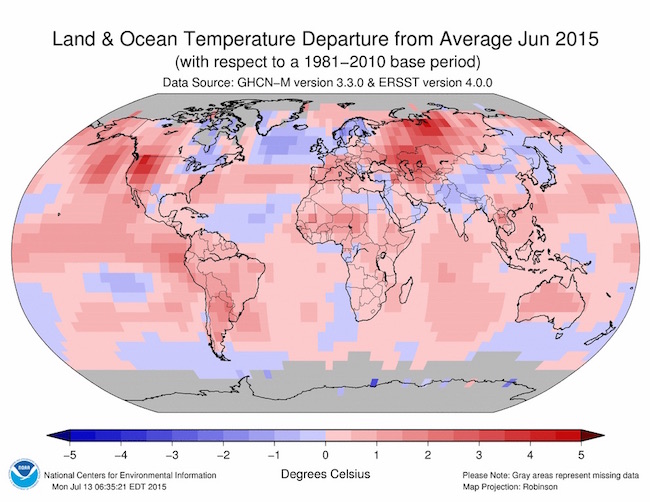
Average temperature in 2014 compared to 1981-2010. Red = warmer. Blue = cooler.
You wouldn’t necessarily suspect record-setting global warmth last year by focusing just on Texas, where it wasn’t particularly hot (by Texas standards). Or by focusing on a few other places marked in blue and white on the map above.
The red areas clearly predominate, however, illustrating one of the lines of statistical evidence that continued to accumulate worldwide in 2014, reinforcing the scientific consensus that people are warming the planet’s atmosphere and changing its climate with fossil-fuel pollution. That evidence was summed up in the 25th annual “State of the Climate” report, issued this week.
Among other highlights was confirmation of previously reported findings that 2014 was the earth’s warmest year on record. Four independent datasets determined the year was the warmest (or tied as warmest).
“State of the Climate in 2014” was based on input from 413 scientists in 58 countries. It was compiled by the federal government’s National Oceanic and Atmospheric Administration and published by the private American Meteorological Society.
The authors identified a number of “key highlights,” including these points:
- The record-breaking warmth was widespread across the planet’s land areas, with the eastern part of North America the only major region with below-average annual temperatures.
- Sea-surface temperatures, averaged globally, reached a record high. In a related measurement, the subsurface heat content of the oceans’ upper waters (the top 2,300 feet) was also at a record high level, “reflecting the continuing accumulation of thermal energy [including more than 90 percent of excess heat from human causes] in the upper layer of the oceans.”
- The global average sea level reached a record high – 67 millimeters (2.63 inches) above the annual mean in 1993, when satellite measurements started.
- “Major greenhouse gas concentrations, including carbon dioxide, methane and nitrous oxide, continued to rise during 2014, once again reaching historic high values.” CO2, the principal heat-trapping gas released in human activities, reached a global average about 12 percent above the level in 1990, the year covered by the first State of the Climate report.
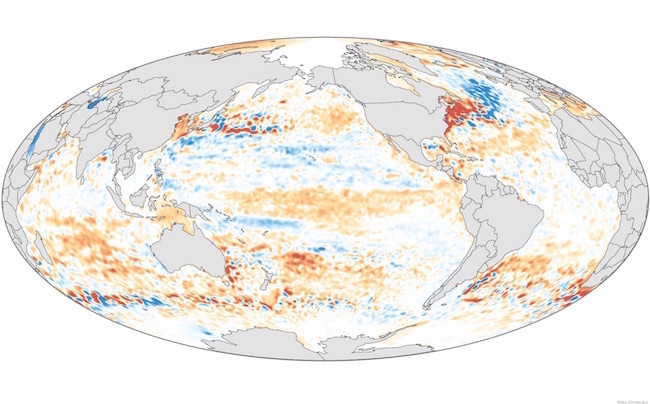
Heat energy in the top 2,300 feet of the ocean in 2014 compared to the 1993-2014 average. Above average = orange. Below average = blue.
“The variety of indicators shows us how our climate is changing, not just in temperature but from the depths of the oceans to the outer atmosphere,” Thomas R. Karl, director of NOAA’s National Centers for Environmental Information, said in a statement upon the 2014 report’s release.
A coincidental development on the day the report was issued illustrated just one of its far-reaching implications: The U.S. and four other nations bordering the Arctic Ocean promised to ban commercial fishing there “until more scientific research could be done on how warming seas and melting ice are affecting fish stocks,” the New York Times reported.
The general account of a warming planet in the “State of the Climate in 2014” document has continued in NOAA’s interim reports on 2015 measurements. The agency announced last month that this May was the hottest May on record and the 2015’s January-May period was the hottest five-month start of any year on record.
[Update 7/20/15: Three climate-tracking agencies – NOAA, NASA and the Japan Meteorological Agency – have reported that June 2015 was the warmest June on record (NASA’s dataset had it tied with June 1998 as warmest). NOAA said its calculations showed June was the third month this year (along with March and May) to have broken its monthly record.]
– Bill Dawson