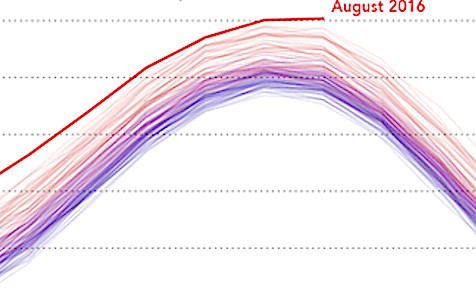
Detail from a NASA Earth Observatory chart showing temperature differences since 1880 from the annual mean for 1980-2015. To view the agency’s animated version of the chart, go to http://tinyurl.com/hksgqr5
By Bill Dawson
Texas Climate News
Here we go again: In the latest in a lengthening string of such announcements, two federal science agencies have said that last month was the planet’s hottest August on record.
It was the 16th month in a row to set such a high-temperature record, according to a report this week by National Oceanic and Atmospheric Administration.
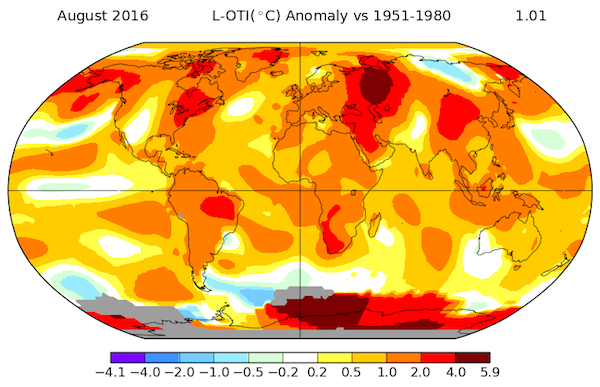
NASA, which assesses global average temperatures somewhat differently than NOAA does, had said last week that August was the 11th straight month with an average record-high temperature – and also was tied with July 2016 as the hottest month ever in records dating back to 1880.
While scientists say the accumulation of heat-trapping pollutants from human activities is the main reason for the string of hot-weather records, a contributory factor has been a cyclical El Niño weather pattern, recently on the wane.
Whether the continuing decline in El Niño’s temperature-boosting effects in coming months is pronounced enough to keep 2016 from setting a new hottest-year record is still uncertain, however.
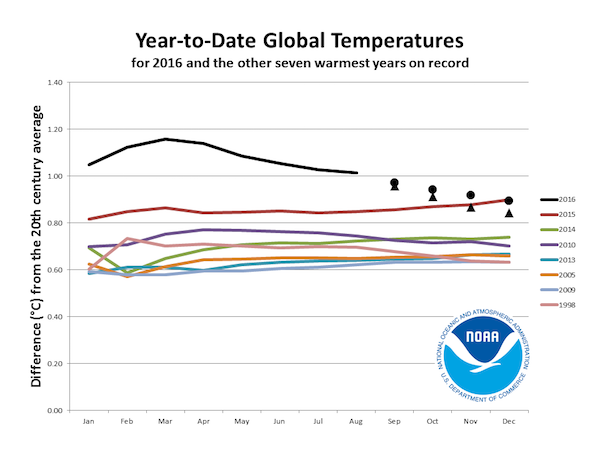
In descending order of their average planetary temperatures, NOAA’s calculations rank the seven hottest years since 1880 as 2015, 2014, 2010, 2013, 2005, 2009 and 1998.
In the graphic immediately below, however, NOAA scientists compared those years’ records and demonstrated a couple of scenarios in which 2016 can end up as the second-warmest year – if this year’s September-December period tracks 1998’s monthly average values (shown as triangles) and if it tracks monthly averages for the 21st century (shown as circles):
Meanwhile, in ice readings
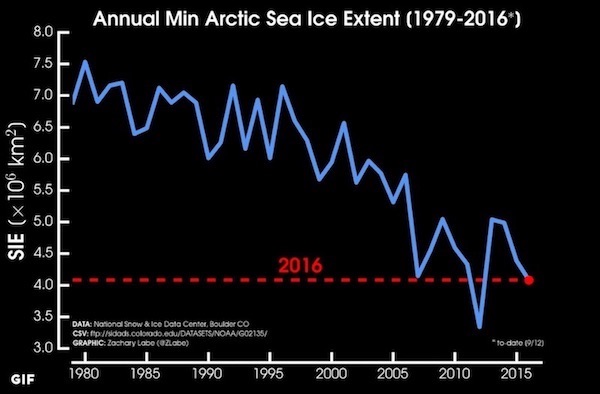
It didn’t set a new record, but Arctic sea ice provided still more evidence of a warming climate, according to a recent report from the National Snow and Ice Data Center.
The area covered by the sea ice at its summer low point this year (1.6 million square miles) was the second smallest in satellite-measurement records – tied with 2007 and eclipsed only by 2012’s 1.3 million square miles, the center said last week.
Mark Serreze, the center’s director, told The Guardian that even tying for second-smallest area, 2016’s number “reinforced the overall downward trend. There is no evidence of recovery here. We’ve always known that the Arctic is going to be the early warning system for climate change. What we’ve seen this year is reinforcing that.”
The center reported that weather “over the Arctic Ocean this past summer has been generally stormy, cool, and cloudy – conditions that previous studies have shown to generally limit the rate of summer ice loss. That September ice extent nevertheless fell to second lowest in the satellite record is hence surprising.”
Writing on the Weather Underground website, the meteorologist and weather and climate journalist Bob Henson observed:
“This year got off to a phenomenal head start, as winter temperatures north of the Arctic Circle were far higher than anything on record. Then the weather turned largely cloudy during the crucial period from late June into August, staving off what might otherwise have been a minimum even lower than 2012’s.”
The unusual sequence of weather conditions from exceptionally warm to cloudy “makes the near-record depletion [of ice] all the more striking and concerning,” Henson wrote.
+++++
Bill Dawson is the founder and editor of Texas Climate News.